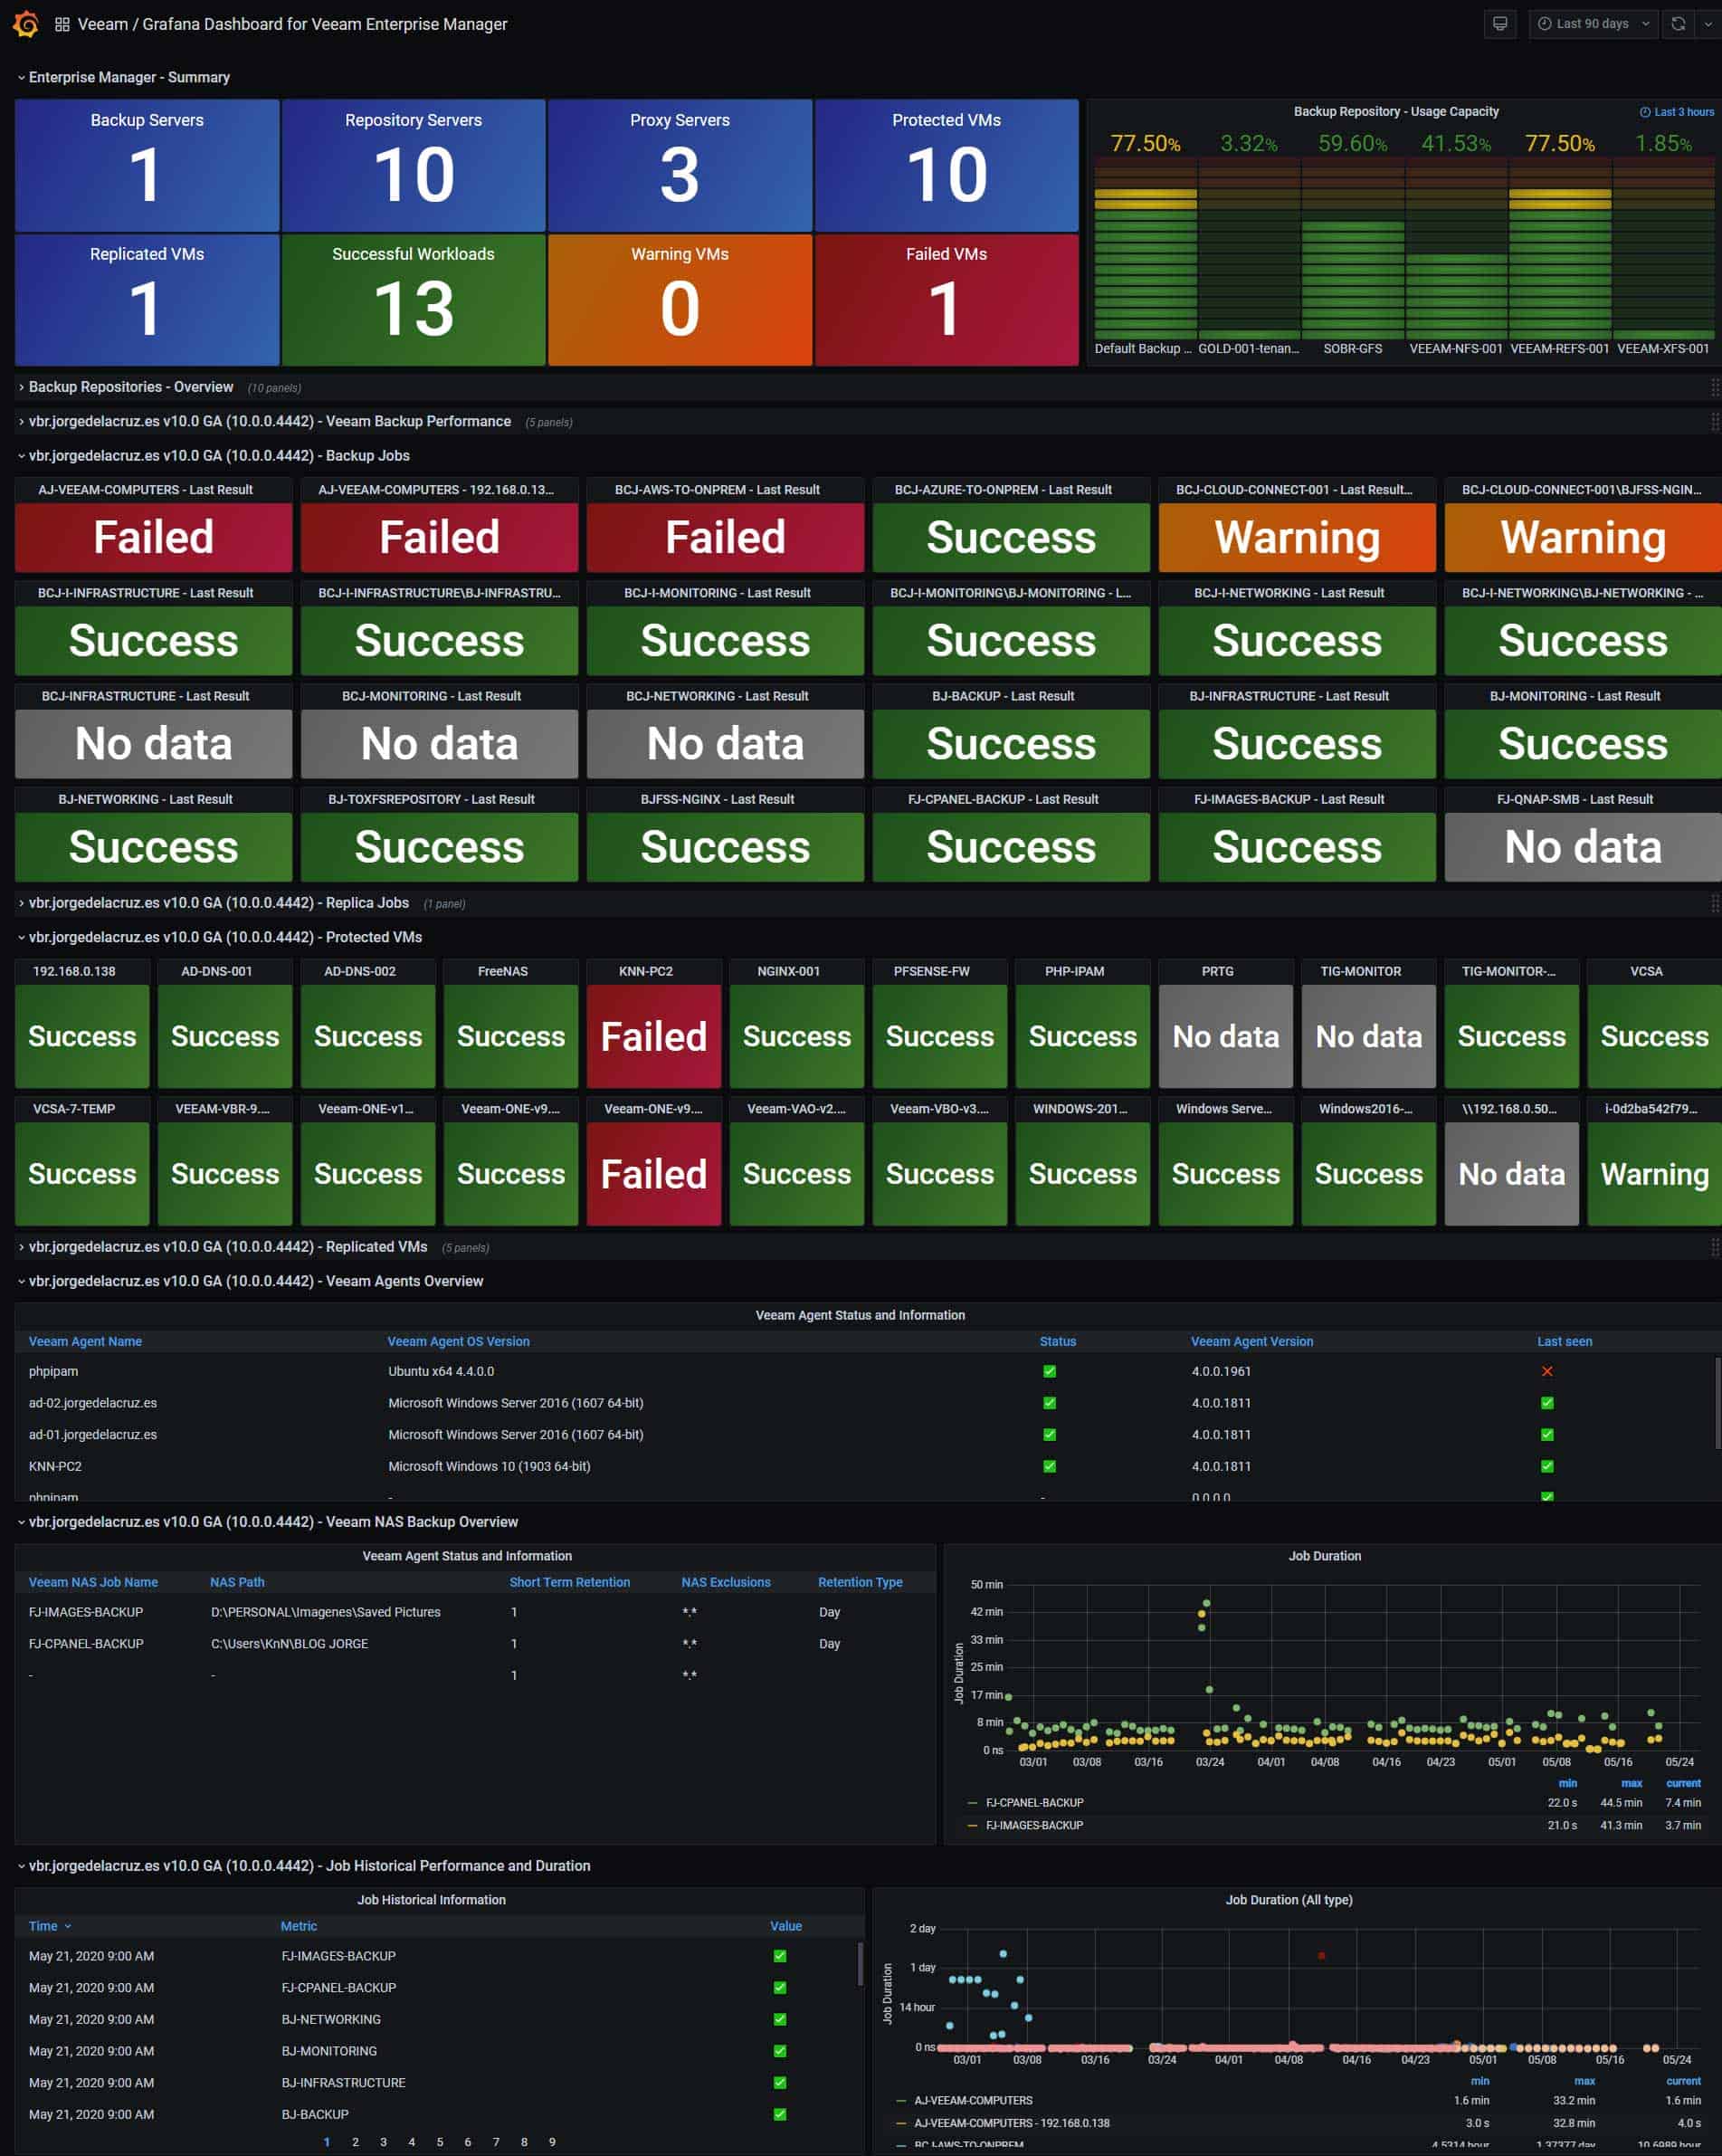
How to monitor a Veeam Environment using Veeam Enterprise Manager, Telegraf, InfluxDB and Grafana

Thanks for the interest on this project.
Getting started
Please follow the next instructions in order to start monitoring your Veeam Enterprise Manager with InmfluxDB v2.0 - https://jorgedelacruz.uk/2020/01/07/looking-for-the-perfect-dashboard-influxdb-telegraf-and-grafana-part-xix-monitoring-veeam-with-enterprise-manager-shell-script/
Or try with this simple steps:
- Download the veeam-enterprisemanager.sh file and change the parameters under Configuration, like username/password, etc. with your real data
- Make the script executable with the command chmod +x veeam-enterprisemanager.sh
- Run the veeam-enterprisemanager.sh and check on Chronograf that you can retrieve the information properly
- Schedule the script execution, for example every 30 minutes using crontab -e
- Download the Veeam Enterprise Manager JSON Dashboard file and import it into your Grafana
- Enjoy :)
InfluxDB 1.8 Note: If you're using InfluxDB 1.8, use the veeam_enterprisemanager.sh file that you can find inside the InfluxDB v1.8 folder.
Important: For the section called Veeam Backup Performance, you will need to install the Telegraf Agent for Windows on the Veeam Backup & Replication Server. Additionally, you will need to edit the hostname on the telegraf.conf for this VBR Server, and use the proper FQDN, like this:
  ## Override default hostname, if empty use os.Hostname()
  hostname = "yourvbr.yourdomain.com"
Additional Information
- The old PowerShell way to retrieve data (which can still be found inside the PowerShell folder) was created thanks to Markus Kraus: https://mycloudrevolution.com/2016/02/29/prtg-veeam-br-monitoring/
Known issues
Would love to see some known issues and keep opening and closing as soon as I have feedback from you guys. Fork this project, use it and please provide feedback.