 onedr0p
commented
4 years ago
onedr0p
commented
4 years ago Duplicate https://github.com/rancher/k3s/issues/294
...This is a known issue for some people
Closed sraillard closed 3 years ago
onedr0p
commented
4 years ago Duplicate https://github.com/rancher/k3s/issues/294
...This is a known issue for some people
 sraillard
commented
4 years ago
sraillard
commented
4 years ago Thanks for the duplicate, I didn't see it. They are more looking at CPU usage than memory usage whereas both are important on low power embedded computers.
And what seems important to me is why this consumption of resources when k3s is idle without any running pod?
 runningman84
commented
4 years ago
runningman84
commented
4 years ago From my point of view it is valid to have a new issue because the old one is closed without any solution.
Especially if you think about the primary use case which is a low powered edge case computing setup.
Fixing or even responding to this issue should be a top priority for the k3s team.
 brandond
commented
4 years ago
brandond
commented
4 years ago 500MB of RAM and 5% cpu is about as good as you are going to get for an entire Kubernetes cluster + infrastructure pods running on a single node. What about this would you like to see fixed? Do you have an example of another Kubernetes distribution that offers similar features in a smaller footprint?
runningman84
commented
4 years ago 500MB of RAM and 5% cpu looks fine for me.
My own experience is more like this:
onedr0p
commented
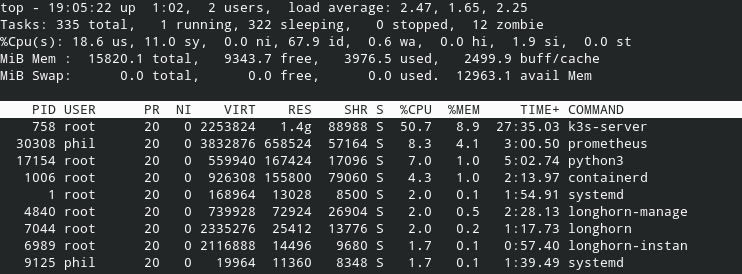
4 years ago Here's a pretty much idle master with no workers and no deployments:

Compared to my master that has 5 workers and about 50 deployments:
You can see the active master is jumping from 20%-150%+ sometimes greater than 300% CPU usage on k3s.
Something seems off to me, but it's working /shrug
sraillard
commented
4 years ago @onedr0p and @runningman84, can you provide the CPU reference of the system? It's looking like you have both system with 16GB memory. In my case, I have only 2GB of memory!
onedr0p
commented
4 years ago My CPU is Intel® Core™ i3-8109U in a NUC8i3BEK, RAM is Crucial 16GB Kit (8GBx2) DDR4 2400 MT/S (PC4-19200) SR x8 SODIMM
brandond
commented
4 years ago Note that unless your explicitly restrict it, golang will make use of additional memory to avoid having to do garbage collection too frequently. You can reduce the memory utilization at the cost of more aggressive GC cleanup by setting a MemoryLimit in the systemd unit:
[Service]
MemoryLimit=768M
Other users have similarly put CPU limits on the k3s service, although I personally think that this might have more negative effects (apiserver throttling, etc) than a memory limit.
onedr0p
commented
4 years ago although I personally think that this might have more negative effects (apiserver throttling, etc) than a memory limit.
That's my mindset too. I do think there is an issue on k3s CPU usage, however, it isn't really affecting me much. Everything seems to be running fine.
runningman84
commented
4 years ago I am running an intel n5000 cpu in a msi cubi system.
sraillard
commented
4 years ago @runningman84: your k3s is running some pods? 50% CPU usage with Intel N5000 seems a lot when idle if really nothing is running.
runningman84
commented
4 years ago I have three nodes running about 100 pods total.
The other two nodes with k3s agents have lower cpu usage because my actual workload is not very resource heavy. (Home assistant, mqtt and other small services)
If you look at the total cpu time is is strange that value of prometheus is way lower than k3s server.
sraillard
commented
4 years ago @runningman84 that's already a nice deployment! When I was thinking at idle, it was also without any deployment!
sraillard
commented
4 years ago I would like at least to understand how the CPU and memory resources are used by the k3s-server process as this process is running multiple threads and for me this isn't easy to understand which thread are consuming resources for which task.
 dkarlovi
commented
4 years ago
dkarlovi
commented
4 years ago I have the exact same issue, k3s server is burning through the CPU for whatever reason, without doing anything (nothing deployed, fresh install just now).
My processor is
Intel(R) Core(TM) i7-7600U CPU @ 2.80GHzand the main k3s server process never drops below 10%.
Attaching to it with strace gets me this:
strace: Process 151534 attached
futex(0x6f8fda8, FUTEX_WAIT_PRIVATE, 0, NULL
and it doesn't output anything, which is weird since it's definitely doing something.
brandond
commented
4 years ago Even when kubernetes isn't "doing anything" it is still constantly running control loops to query the state of the system, compare that to the desired state, and determine if anything needs to be changed. It is also constantly health checking endpoints, collecting metrics, renewing locks, etc. It is never truly idle, which is why you will see a baseline amount of CPU usage even without a workload.
dkarlovi
commented
4 years ago @brandond seems like quite a high baseline, no? This isn't a raspberry Pi, It's a decent laptop which runs Java IDEs, etc effortlessly, 10% baseline in "idle" seems high to me.
sraillard
commented
4 years ago I'm trying to search where the CPU cycles are going.
I have done some tests with the perf tool, running perf record -g -a sleep 10 then perf report to see what happen:

perf tool can provide detailed information, but I'm lacking some symbol information to identify the stack trace in the k3s process. Anyone know how to get symbols?
 tim-brand
commented
4 years ago
tim-brand
commented
4 years ago I'm seeing this behaviour too on my Pi4. Fresh installation with mariadb as external database.
The load average is about 2.xx.
When I enable the verbose logging, I noticed that it's continuously polling it's own API. Probably to get some status updates.
Log of a couple of seconds:
Sep 23 20:01:06 pi04 k3s[2957]: I0923 20:01:06.497988    2957 httplog.go:90] verb="GET" URI="/apis/coordination.k8s.io/v1/namespaces/kube-system/leases/kube-controller-manager?timeout=10s" latency=229.097323ms resp=200 UserAgent="k3s/v1.18.8+k3s1 (linux/arm) kubernetes/6b59531/leader-election" srcIP="127.0.0.1:50944":
Sep 23 20:01:06 pi04 k3s[2957]: I0923 20:01:06.501590    2957 httplog.go:90] verb="GET" URI="/api/v1/namespaces/kube-system/endpoints/rancher.io-local-path" latency=43.852989ms resp=200 UserAgent="local-path-provisioner/v0.0.0 (linux/arm) kubernetes/$Format" srcIP="10.42.0.20:51466":
Sep 23 20:01:06 pi04 k3s[2957]: I0923 20:01:06.674860    2957 httplog.go:90] verb="POST" URI="/apis/authorization.k8s.io/v1beta1/subjectaccessreviews" latency=3.125171ms resp=201 UserAgent="metrics-server/v0.0.0 (linux/arm) kubernetes/$Format" srcIP="10.42.0.21:58670":
Sep 23 20:01:06 pi04 k3s[2957]: I0923 20:01:06.694806    2957 httplog.go:90] verb="PUT" URI="/api/v1/namespaces/kube-system/endpoints/kube-scheduler?timeout=10s" latency=438.23441ms resp=200 UserAgent="k3s/v1.18.8+k3s1 (linux/arm) kubernetes/6b59531/leader-election" srcIP="127.0.0.1:50942":
Sep 23 20:01:06 pi04 k3s[2957]: I0923 20:01:06.924280    2957 httplog.go:90] verb="GET" URI="/apis/coordination.k8s.io/v1/namespaces/kube-system/leases/kube-scheduler?timeout=10s" latency=226.324982ms resp=200 UserAgent="k3s/v1.18.8+k3s1 (linux/arm) kubernetes/6b59531/leader-election" srcIP="127.0.0.1:50942":
Sep 23 20:01:06 pi04 k3s[2957]: I0923 20:01:06.925416    2957 httplog.go:90] verb="GET" URI="/api/v1/namespaces/kube-system/endpoints/cloud-controller-manager" latency=157.401198ms resp=200 UserAgent="k3s/v1.18.8+k3s1 (linux/arm) kubernetes/6b59531/leader-election" srcIP="127.0.0.1:50946":
Sep 23 20:01:06 pi04 k3s[2957]: I0923 20:01:06.968878    2957 httplog.go:90] verb="GET" URI="/apis/coordination.k8s.io/v1/namespaces/kube-system/leases/cloud-controller-manager" latency=32.041685ms resp=200 UserAgent="k3s/v1.18.8+k3s1 (linux/arm) kubernetes/6b59531/leader-election" srcIP="127.0.0.1:50946":
Sep 23 20:01:07 pi04 k3s[2957]: I0923 20:01:07.048136    2957 trace.go:116] Trace[513042036]: "GuaranteedUpdate etcd3" type:*core.Endpoints (started: 2020-09-23 20:01:06.506811767 +0100 BST m=+320.072085415) (total time: 541.215729ms):
Sep 23 20:01:07 pi04 k3s[2957]: Trace[513042036]: [541.109545ms] [538.614941ms] Transaction committed
Sep 23 20:01:07 pi04 k3s[2957]: I0923 20:01:07.049541    2957 trace.go:116] Trace[1314711001]: "Update" url:/api/v1/namespaces/kube-system/endpoints/rancher.io-local-path,user-agent:local-path-provisioner/v0.0.0 (linux/arm) kubernetes/$Format,client:10.42.0.20 (started: 2020-09-23 20:01:06.506106978 +0100 BST m=+320.071380459) (total time: 543.302078ms):
Sep 23 20:01:07 pi04 k3s[2957]: Trace[1314711001]: [543.05071ms] [542.561937ms] Object stored in database
Sep 23 20:01:07 pi04 k3s[2957]: I0923 20:01:07.050504    2957 httplog.go:90] verb="PUT" URI="/api/v1/namespaces/kube-system/endpoints/rancher.io-local-path" latency=545.431297ms resp=200 UserAgent="local-path-provisioner/v0.0.0 (linux/arm) kubernetes/$Format" srcIP="10.42.0.20:51466":
Sep 23 20:01:07 pi04 k3s[2957]: I0923 20:01:07.153250    2957 trace.go:116] Trace[1034599144]: "GuaranteedUpdate etcd3" type:*coordination.Lease (started: 2020-09-23 20:01:06.531187866 +0100 BST m=+320.096461514) (total time: 621.93976ms):
Sep 23 20:01:07 pi04 k3s[2957]: Trace[1034599144]: [621.785706ms] [619.544582ms] Transaction committed
Sep 23 20:01:07 pi04 k3s[2957]: I0923 20:01:07.154835    2957 httplog.go:90] verb="PUT" URI="/apis/coordination.k8s.io/v1/namespaces/kube-system/leases/kube-scheduler?timeout=10s" latency=225.27927ms resp=200 UserAgent="k3s/v1.18.8+k3s1 (linux/arm) kubernetes/6b59531/leader-election" srcIP="127.0.0.1:50942":
Sep 23 20:01:07 pi04 k3s[2957]: I0923 20:01:07.158783    2957 trace.go:116] Trace[2020735212]: "Update" url:/apis/coordination.k8s.io/v1/namespaces/kube-system/leases/kube-controller-manager,user-agent:k3s/v1.18.8+k3s1 (linux/arm) kubernetes/6b59531/leader-election,client:127.0.0.1 (started: 2020-09-23 20:01:06.530663186 +0100 BST m=+320.095936630) (total time: 627.755515ms):
Sep 23 20:01:07 pi04 k3s[2957]: Trace[2020735212]: [622.705401ms] [622.342794ms] Object stored in database
Sep 23 20:01:07 pi04 k3s[2957]: I0923 20:01:07.159369    2957 httplog.go:90] verb="PUT" URI="/apis/coordination.k8s.io/v1/namespaces/kube-system/leases/kube-controller-manager?timeout=10s" latency=657.25856ms resp=200 UserAgent="k3s/v1.18.8+k3s1 (linux/arm) kubernetes/6b59531/leader-election" srcIP="127.0.0.1:50944":
Sep 23 20:01:07 pi04 k3s[2957]: I0923 20:01:07.251811    2957 kubelet_pods.go:1360] Generating status for "helm-install-traefik-vn8mx_kube-system(c4f4af74-ec2a-4ef8-a44d-34cfcaec7f0f)"
Sep 23 20:01:07 pi04 k3s[2957]: I0923 20:01:07.252795    2957 status_manager.go:435] Ignoring same status for pod "helm-install-traefik-vn8mx_kube-system(c4f4af74-ec2a-4ef8-a44d-34cfcaec7f0f)", status: {Phase:Running Conditions:[{Type:Initialized Status:True LastProbeTime:0001-01-01 00:00:00 +0000 UTC LastTransitionTime:2020-09-23 19:56:28 +0100 BST Reason: Message:} {Type:Ready Status:False LastProbeTime:0001-01-01 00:00:00 +0000 UTC LastTransitionTime:2020-09-23 19:59:35 +0100 BST Reason:ContainersNotReady Message:containers with unready status: [helm]} {Type:ContainersReady Status:False LastProbeTime:0001-01-01 00:00:00 +0000 UTC LastTransitionTime:2020-09-23 19:59:35 +0100 BST Reason:ContainersNotReady Message:containers with unready status: [helm]} {Type:PodScheduled Status:True LastProbeTime:0001-01-01 00:00:00 +0000 UTC LastTransitionTime:2020-09-23 19:56:28 +0100 BST Reason: Message:}] Message: Reason: NominatedNodeName: HostIP:192.168.1.24 PodIP:10.42.0.23 PodIPs:[{IP:10.42.0.23}] StartTime:2020-09-23 19:56:28 +0100 BST InitContainerStatuses:[] ContainerStatuses:[{Name:helm State:{Waiting:&ContainerStateWaiting{Reason:CrashLoopBackOff,Message:back-off 2m40s restarting failed container=helm pod=helm-install-traefik-vn8mx_kube-system(c4f4af74-ec2a-4ef8-a44d-34cfcaec7f0f),} Running:nil Terminated:nil} LastTerminationState:{Waiting:nil Running:nil Terminated:&ContainerStateTerminated{ExitCode:1,Signal:0,Reason:Error,Message:,StartedAt:2020-09-23 19:59:32 +0100 BST,FinishedAt:2020-09-23 19:59:34 +0100 BST,ContainerID:containerd://131f84560892f7e5f197bf36e1f9933a4c419058882b7222952acb582695e166,}} Ready:false RestartCount:5 Image:docker.io/rancher/klipper-helm:v0.2.5 ImageID:docker.io/rancher/klipper-helm@sha256:b694f931ffb70c4e0b6aedf69171936cad98e79a5df49372f0e553d7d610062d ContainerID:containerd://131f84560892f7e5f197bf36e1f9933a4c419058882b7222952acb582695e166 Started:0xd52717c}] QOSClass:BestEffort EphemeralContainerStatuses:[]}
Sep 23 20:01:07 pi04 k3s[2957]: I0923 20:01:07.254312    2957 volume_manager.go:372] Waiting for volumes to attach and mount for pod "helm-install-traefik-vn8mx_kube-system(c4f4af74-ec2a-4ef8-a44d-34cfcaec7f0f)"
Sep 23 20:01:07 pi04 k3s[2957]: I0923 20:01:07.254484    2957 volume_manager.go:403] All volumes are attached and mounted for pod "helm-install-traefik-vn8mx_kube-system(c4f4af74-ec2a-4ef8-a44d-34cfcaec7f0f)"
Sep 23 20:01:07 pi04 k3s[2957]: I0923 20:01:07.254568    2957 topology_manager.go:219] [topologymanager] RemoveContainer - Container ID: 131f84560892f7e5f197bf36e1f9933a4c419058882b7222952acb582695e166
Sep 23 20:01:07 pi04 k3s[2957]: I0923 20:01:07.255044    2957 kuberuntime_manager.go:579] Container {Name:helm Image:rancher/klipper-helm:v0.2.5 Command:[] Args:[install] WorkingDir: Ports:[] EnvFrom:[] Env:[{Name:NAME Value:traefik ValueFrom:nil} {Name:VERSION Value: ValueFrom:nil} {Name:REPO Value: ValueFrom:nil} {Name:VALUES_HASH Value:cfaa420eb38db08e829c9f1359fe1688d72fad5b816f2c99a4f23b58e94680fb ValueFrom:nil} {Name:HELM_DRIVER Value:secret ValueFrom:nil} {Name:CHART_NAMESPACE Value:kube-system ValueFrom:nil} {Name:CHART Value:https://%!{(MISSING)KUBERNETES_API}%!/(MISSING)static/charts/traefik-1.81.0.tgz ValueFrom:nil} {Name:HELM_VERSION Value: ValueFrom:nil} {Name:NO_PROXY Value:,10.42.0.0/16,10.43.0.0/16 ValueFrom:nil}] Resources:{Limits:map[] Requests:map[]} VolumeMounts:[{Name:values ReadOnly:false MountPath:/config SubPath: MountPropagation:<nil> SubPathExpr:} {Name:helm-traefik-token-cdrk2 ReadOnly:true MountPath:/var/run/secrets/kubernetes.io/serviceaccount SubPath: MountPropagation:<nil> SubPathExpr:}] VolumeDevices:[] LivenessProbe:nil ReadinessProbe:nil StartupProbe:nil Lifecycle:nil TerminationMessagePath:/dev/termination-log TerminationMessagePolicy:File ImagePullPolicy:IfNotPresent SecurityContext:nil Stdin:false StdinOnce:false TTY:false} is dead, but RestartPolicy says that we should restart it.
Sep 23 20:01:07 pi04 k3s[2957]: I0923 20:01:07.255616    2957 kuberuntime_manager.go:650] computePodActions got {KillPod:false CreateSandbox:false SandboxID:bc98db60dc7d81120daccaa892439205eac60be120d84b4ef1854ece022e2325 Attempt:0 NextInitContainerToStart:nil ContainersToStart:[0] ContainersToKill:map[] EphemeralContainersToStart:[]} for pod "helm-install-traefik-vn8mx_kube-system(c4f4af74-ec2a-4ef8-a44d-34cfcaec7f0f)"
Sep 23 20:01:07 pi04 k3s[2957]: I0923 20:01:07.256156    2957 kuberuntime_manager.go:853] checking backoff for container "helm" in pod "helm-install-traefik-vn8mx_kube-system(c4f4af74-ec2a-4ef8-a44d-34cfcaec7f0f)"
Sep 23 20:01:07 pi04 k3s[2957]: I0923 20:01:07.257872    2957 kuberuntime_manager.go:863] back-off 2m40s restarting failed container=helm pod=helm-install-traefik-vn8mx_kube-system(c4f4af74-ec2a-4ef8-a44d-34cfcaec7f0f)
Sep 23 20:01:07 pi04 k3s[2957]: E0923 20:01:07.258076    2957 pod_workers.go:191] Error syncing pod c4f4af74-ec2a-4ef8-a44d-34cfcaec7f0f ("helm-install-traefik-vn8mx_kube-system(c4f4af74-ec2a-4ef8-a44d-34cfcaec7f0f)"), skipping: failed to "StartContainer" for "helm" with CrashLoopBackOff: "back-off 2m40s restarting failed container=helm pod=helm-install-traefik-vn8mx_kube-system(c4f4af74-ec2a-4ef8-a44d-34cfcaec7f0f)"
Sep 23 20:01:07 pi04 k3s[2957]: I0923 20:01:07.258391    2957 event.go:278] Event(v1.ObjectReference{Kind:"Pod", Namespace:"kube-system", Name:"helm-install-traefik-vn8mx", UID:"c4f4af74-ec2a-4ef8-a44d-34cfcaec7f0f", APIVersion:"v1", ResourceVersion:"143488", FieldPath:"spec.containers{helm}"}): type: 'Warning' reason: 'BackOff' Back-off restarting failed container
Sep 23 20:01:07 pi04 k3s[2957]: I0923 20:01:07.308824    2957 httplog.go:90] verb="PUT" URI="/api/v1/namespaces/kube-system/endpoints/cloud-controller-manager" latency=337.466715ms resp=200 UserAgent="k3s/v1.18.8+k3s1 (linux/arm) kubernetes/6b59531/leader-election" srcIP="127.0.0.1:50946":
Sep 23 20:01:07 pi04 k3s[2957]: I0923 20:01:07.329494    2957 httplog.go:90] verb="GET" URI="/apis/coordination.k8s.io/v1/namespaces/kube-system/leases/cloud-controller-manager" latency=19.205301ms resp=200 UserAgent="k3s/v1.18.8+k3s1 (linux/arm) kubernetes/6b59531/leader-election" srcIP="127.0.0.1:50946":
Sep 23 20:01:07 pi04 k3s[2957]: I0923 20:01:07.363564    2957 configmap.go:188] Setting up volume values for pod c4f4af74-ec2a-4ef8-a44d-34cfcaec7f0f at /var/lib/kubelet/pods/c4f4af74-ec2a-4ef8-a44d-34cfcaec7f0f/volumes/kubernetes.io~configmap/values
Sep 23 20:01:07 pi04 k3s[2957]: I0923 20:01:07.363661    2957 secret.go:183] Setting up volume helm-traefik-token-cdrk2 for pod c4f4af74-ec2a-4ef8-a44d-34cfcaec7f0f at /var/lib/kubelet/pods/c4f4af74-ec2a-4ef8-a44d-34cfcaec7f0f/volumes/kubernetes.io~secret/helm-traefik-token-cdrk2
Sep 23 20:01:07 pi04 k3s[2957]: I0923 20:01:07.363727    2957 secret.go:207] Received secret kube-system/helm-traefik-token-cdrk2 containing (3) pieces of data, 1467 total bytes
Sep 23 20:01:07 pi04 k3s[2957]: I0923 20:01:07.363664    2957 configmap.go:212] Received configMap kube-system/chart-values-traefik containing (1) pieces of data, 340 total bytes
Sep 23 20:01:07 pi04 k3s[2957]: I0923 20:01:07.454765    2957 httplog.go:90] verb="PUT" URI="/apis/coordination.k8s.io/v1/namespaces/kube-system/leases/cloud-controller-manager" latency=123.683011ms resp=200 UserAgent="k3s/v1.18.8+k3s1 (linux/arm) kubernetes/6b59531/leader-election" srcIP="127.0.0.1:50946":
Sep 23 20:01:07 pi04 k3s[2957]: I0923 20:01:07.632406    2957 httplog.go:90] verb="GET" URI="/api/v1/namespaces/default" latency=3.63161ms resp=200 UserAgent="k3s/v1.18.8+k3s1 (linux/arm) kubernetes/6b59531" srcIP="127.0.0.1:50882":
Sep 23 20:01:07 pi04 k3s[2957]: I0923 20:01:07.637465    2957 httplog.go:90] verb="GET" URI="/api/v1/namespaces/default/services/kubernetes" latency=3.603499ms resp=200 UserAgent="k3s/v1.18.8+k3s1 (linux/arm) kubernetes/6b59531" srcIP="127.0.0.1:50882":
Sep 23 20:01:07 pi04 k3s[2957]: I0923 20:01:07.945710    2957 httplog.go:90] verb="GET" URI="/api/v1/namespaces/default/endpoints/kubernetes" latency=74.195155ms resp=200 UserAgent="k3s/v1.18.8+k3s1 (linux/arm) kubernetes/6b59531" srcIP="127.0.0.1:50882":
Sep 23 20:01:07 pi04 k3s[2957]: I0923 20:01:07.951429    2957 httplog.go:90] verb="GET" URI="/api/v1/namespaces/kube-system/configmaps/k3s" latency=234.064587ms resp=200 UserAgent="k3s/v1.18.8+k3s1 (linux/arm) kubernetes/6b59531" srcIP="127.0.0.1:50854":
Sep 23 20:01:07 pi04 k3s[2957]: I0923 20:01:07.955366    2957 httplog.go:90] verb="GET" URI="/apis/discovery.k8s.io/v1beta1/namespaces/default/endpointslices/kubernetes" latency=3.309818ms resp=200 UserAgent="k3s/v1.18.8+k3s1 (linux/arm) kubernetes/6b59531" srcIP="127.0.0.1:50882":
Sep 23 20:01:08 pi04 k3s[2957]: I0923 20:01:08.125626    2957 httplog.go:90] verb="GET" URI="/apis/batch/v1/jobs?limit=500" latency=11.610639ms resp=200 UserAgent="k3s/v1.18.8+k3s1 (linux/arm) kubernetes/6b59531/system:serviceaccount:kube-system:cronjob-controller" srcIP="127.0.0.1:51234":
Sep 23 20:01:08 pi04 k3s[2957]: I0923 20:01:08.138736    2957 httplog.go:90] verb="GET" URI="/apis/batch/v1beta1/cronjobs?limit=500" latency=9.640252ms resp=200 UserAgent="k3s/v1.18.8+k3s1 (linux/arm) kubernetes/6b59531/system:serviceaccount:kube-system:cronjob-controller" srcIP="127.0.0.1:51234":
Sep 23 20:01:08 pi04 k3s[2957]: I0923 20:01:08.205078    2957 httplog.go:90] verb="PUT" URI="/api/v1/namespaces/kube-system/configmaps/k3s" latency=252.034436ms resp=200 UserAgent="k3s/v1.18.8+k3s1 (linux/arm) kubernetes/6b59531" srcIP="127.0.0.1:50854":
Sep 23 20:01:08 pi04 k3s[2957]: I0923 20:01:08.262686    2957 httplog.go:90] verb="GET" URI="/apis/apps/v1/statefulsets?allowWatchBookmarks=true&resourceVersion=143375&timeoutSeconds=300&watch=true" latency=5m0.001024436s resp=0 UserAgent="kubernetic-backend/v0.0.0 (darwin/amd64) kubernetes/$Format" srcIP="192.168.1.168:60441":
Sep 23 20:01:08 pi04 k3s[2957]: I0923 20:01:08.267509    2957 get.go:251] Starting watch for /apis/apps/v1/statefulsets, rv=143375 labels= fields= timeout=8m25s
Sep 23 20:01:08 pi04 k3s[2957]: I0923 20:01:08.301780    2957 node_lifecycle_controller.go:1082] Node pi04 ReadyCondition updated. Updating timestamp.
Sep 23 20:01:09 pi04 k3s[2957]: I0923 20:01:09.073484    2957 httplog.go:90] verb="GET" URI="/api/v1/namespaces/kube-system/endpoints/rancher.io-local-path" latency=20.639581ms resp=200 UserAgent="local-path-provisioner/v0.0.0 (linux/arm) kubernetes/$Format" srcIP="10.42.0.20:51466":
Sep 23 20:01:09 pi04 k3s[2957]: I0923 20:01:09.076581    2957 httplog.go:90] verb="PUT" URI="/apis/coordination.k8s.io/v1/namespaces/kube-node-lease/leases/pi04?timeout=10s" latency=220.10699ms resp=200 UserAgent="k3s/v1.18.8+k3s1 (linux/arm) kubernetes/6b59531" srcIP="127.0.0.1:59706":
Sep 23 20:01:09 pi04 k3s[2957]: I0923 20:01:09.192035    2957 httplog.go:90] verb="GET" URI="/api/v1/namespaces/kube-system/endpoints/kube-scheduler?timeout=10s" latency=31.520894ms resp=200 UserAgent="k3s/v1.18.8+k3s1 (linux/arm) kubernetes/6b59531/leader-election" srcIP="127.0.0.1:50942":
Sep 23 20:01:09 pi04 k3s[2957]: I0923 20:01:09.197971    2957 httplog.go:90] verb="GET" URI="/api/v1/namespaces/kube-system/endpoints/kube-controller-manager?timeout=10s" latency=34.589919ms resp=200 UserAgent="k3s/v1.18.8+k3s1 (linux/arm) kubernetes/6b59531/leader-election" srcIP="127.0.0.1:50944":
Sep 23 20:01:09 pi04 k3s[2957]: I0923 20:01:09.219586    2957 httplog.go:90] verb="GET" URI="/apis/coordination.k8s.io/v1/namespaces/kube-system/leases/kube-scheduler?timeout=10s" latency=25.513772ms resp=200 UserAgent="k3s/v1.18.8+k3s1 (linux/arm) kubernetes/6b59531/leader-election" srcIP="127.0.0.1:50942":
Sep 23 20:01:09 pi04 k3s[2957]: I0923 20:01:09.227292    2957 httplog.go:90] verb="GET" URI="/apis/coordination.k8s.io/v1/namespaces/kube-system/leases/kube-controller-manager?timeout=10s" latency=27.308975ms resp=200 UserAgent="k3s/v1.18.8+k3s1 (linux/arm) kubernetes/6b59531/leader-election" srcIP="127.0.0.1:50944":
Sep 23 20:01:09 pi04 k3s[2957]: I0923 20:01:09.299614    2957 httplog.go:90] verb="GET" URI="/api/v1/nodes?allowWatchBookmarks=true&resourceVersion=143375&timeout=5m7s&timeoutSeconds=307&watch=true" latency=5m7.059877608s resp=0 UserAgent="k3s/v1.18.8+k3s1 (linux/arm) kubernetes/6b59531" srcIP="127.0.0.1:59630":
Sep 23 20:01:09 pi04 k3s[2957]: I0923 20:01:09.318570    2957 get.go:251] Starting watch for /api/v1/nodes, rv=144516 labels= fields= timeout=8m59s
Sep 23 20:01:09 pi04 k3s[2957]: I0923 20:01:09.361156    2957 httplog.go:90] verb="PUT" URI="/api/v1/namespaces/kube-system/endpoints/rancher.io-local-path" latency=284.717874ms resp=200 UserAgent="local-path-provisioner/v0.0.0 (linux/arm) kubernetes/$Format" srcIP="10.42.0.20:51466":
Sep 23 20:01:09 pi04 k3s[2957]: I0923 20:01:09.504338    2957 httplog.go:90] verb="GET" URI="/api/v1/namespaces/kube-system/endpoints/cloud-controller-manager" latency=47.472451ms resp=200 UserAgent="k3s/v1.18.8+k3s1 (linux/arm) kubernetes/6b59531/leader-election" srcIP="127.0.0.1:50946":
Sep 23 20:01:09 pi04 k3s[2957]: I0923 20:01:09.533982    2957 httplog.go:90] verb="GET" URI="/apis/coordination.k8s.io/v1/namespaces/kube-system/leases/cloud-controller-manager" latency=26.61226ms resp=200 UserAgent="k3s/v1.18.8+k3s1 (linux/arm) kubernetes/6b59531/leader-election" srcIP="127.0.0.1:50946":
Sep 23 20:01:09 pi04 k3s[2957]: I0923 20:01:09.548994    2957 httplog.go:90] verb="PUT" URI="/api/v1/namespaces/kube-system/endpoints/kube-controller-manager?timeout=10s" latency=319.076813ms resp=200 UserAgent="k3s/v1.18.8+k3s1 (linux/arm) kubernetes/6b59531/leader-election" srcIP="127.0.0.1:50944":
Sep 23 20:01:09 pi04 k3s[2957]: I0923 20:01:09.548994    2957 httplog.go:90] verb="PUT" URI="/api/v1/namespaces/kube-system/endpoints/kube-scheduler?timeout=10s" latency=327.407356ms resp=200 UserAgent="k3s/v1.18.8+k3s1 (linux/arm) kubernetes/6b59531/leader-election" srcIP="127.0.0.1:50942":
Sep 23 20:01:09 pi04 k3s[2957]: I0923 20:01:09.578750    2957 httplog.go:90] verb="GET" URI="/apis/coordination.k8s.io/v1/namespaces/kube-system/leases/kube-controller-manager?timeout=10s" latency=27.304513ms resp=200 UserAgent="k3s/v1.18.8+k3s1 (linux/arm) kubernetes/6b59531/leader-election" srcIP="127.0.0.1:50944":
Sep 23 20:01:09 pi04 k3s[2957]: I0923 20:01:09.580092    2957 httplog.go:90] verb="GET" URI="/apis/coordination.k8s.io/v1/namespaces/kube-system/leases/kube-scheduler?timeout=10s" latency=28.079431ms resp=200 UserAgent="k3s/v1.18.8+k3s1 (linux/arm) kubernetes/6b59531/leader-election" srcIP="127.0.0.1:50942":
Sep 23 20:01:09 pi04 k3s[2957]: I0923 20:01:09.746154    2957 httplog.go:90] verb="PUT" URI="/api/v1/namespaces/kube-system/endpoints/cloud-controller-manager" latency=210.200222ms resp=200 UserAgent="k3s/v1.18.8+k3s1 (linux/arm) kubernetes/6b59531/leader-election" srcIP="127.0.0.1:50946":
Sep 23 20:01:09 pi04 k3s[2957]: I0923 20:01:09.746252    2957 httplog.go:90] verb="PUT" URI="/apis/coordination.k8s.io/v1/namespaces/kube-system/leases/kube-controller-manager?timeout=10s" latency=163.893241ms resp=200 UserAgent="k3s/v1.18.8+k3s1 (linux/arm) kubernetes/6b59531/leader-election" srcIP="127.0.0.1:50944":
Sep 23 20:01:09 pi04 k3s[2957]: I0923 20:01:09.747938    2957 httplog.go:90] verb="PUT" URI="/apis/coordination.k8s.io/v1/namespaces/kube-system/leases/kube-scheduler?timeout=10s" latency=163.128601ms resp=200 UserAgent="k3s/v1.18.8+k3s1 (linux/arm) kubernetes/6b59531/leader-election" srcIP="127.0.0.1:50942":
Sep 23 20:01:09 pi04 k3s[2957]: I0923 20:01:09.767008    2957 httplog.go:90] verb="GET" URI="/apis/coordination.k8s.io/v1/namespaces/kube-system/leases/cloud-controller-manager" latency=19.219356ms resp=200 UserAgent="k3s/v1.18.8+k3s1 (linux/arm) kubernetes/6b59531/leader-election" srcIP="127.0.0.1:50946":
Sep 23 20:01:10 pi04 k3s[2957]: I0923 20:01:10.006917    2957 httplog.go:90] verb="PUT" URI="/apis/coordination.k8s.io/v1/namespaces/kube-system/leases/cloud-controller-manager" latency=238.376022ms resp=200 UserAgent="k3s/v1.18.8+k3s1 (linux/arm) kubernetes/6b59531/leader-election" srcIP="127.0.0.1:50946":
Sep 23 20:01:10 pi04 k3s[2957]: I0923 20:01:10.230235    2957 httplog.go:90] verb="GET" URI="/api/v1/namespaces/kube-system/configmaps/k3s" latency=21.579832ms resp=200 UserAgent="k3s/v1.18.8+k3s1 (linux/arm) kubernetes/6b59531" srcIP="127.0.0.1:50854":
Sep 23 20:01:10 pi04 k3s[2957]: I0923 20:01:10.401834    2957 httplog.go:90] verb="PUT" URI="/api/v1/namespaces/kube-system/configmaps/k3s" latency=169.75692ms resp=200 UserAgent="k3s/v1.18.8+k3s1 (linux/arm) kubernetes/6b59531" srcIP="127.0.0.1:50854":
Sep 23 20:01:11 pi04 k3s[2957]: I0923 20:01:11.148816    2957 httplog.go:90] verb="GET" URI="/api/v1/limitranges?allowWatchBookmarks=true&resourceVersion=143375&timeout=5m15s&timeoutSeconds=315&watch=true" latency=5m15.000963051s resp=0 UserAgent="k3s/v1.18.8+k3s1 (linux/arm) kubernetes/6b59531" srcIP="127.0.0.1:50882":
Sep 23 20:01:11 pi04 k3s[2957]: I0923 20:01:11.152235    2957 get.go:251] Starting watch for /api/v1/limitranges, rv=143375 labels= fields= timeout=8m46s
Sep 23 20:01:11 pi04 k3s[2957]: I0923 20:01:11.378513    2957 httplog.go:90] verb="GET" URI="/api/v1/namespaces/kube-system/endpoints/rancher.io-local-path" latency=14.368536ms resp=200 UserAgent="local-path-provisioner/v0.0.0 (linux/arm) kubernetes/$Format" srcIP="10.42.0.20:51466":
Sep 23 20:01:11 pi04 k3s[2957]: I0923 20:01:11.695761    2957 httplog.go:90] verb="PUT" URI="/api/v1/namespaces/kube-system/endpoints/rancher.io-local-path" latency=314.344491ms resp=200 UserAgent="local-path-provisioner/v0.0.0 (linux/arm) kubernetes/$Format" srcIP="10.42.0.20:51466":
Sep 23 20:01:11 pi04 k3s[2957]: I0923 20:01:11.782133    2957 httplog.go:90] verb="GET" URI="/api/v1/namespaces/kube-system/endpoints/kube-controller-manager?timeout=10s" latency=33.696187ms resp=200 UserAgent="k3s/v1.18.8+k3s1 (linux/arm) kubernetes/6b59531/leader-election" srcIP="127.0.0.1:50944":
Sep 23 20:01:11 pi04 k3s[2957]: I0923 20:01:11.784563    2957 httplog.go:90] verb="GET" URI="/api/v1/namespaces/kube-system/endpoints/kube-scheduler?timeout=10s" latency=33.834333ms resp=200 UserAgent="k3s/v1.18.8+k3s1 (linux/arm) kubernetes/6b59531/leader-election" srcIP="127.0.0.1:50942":
Sep 23 20:01:11 pi04 k3s[2957]: I0923 20:01:11.817426    2957 httplog.go:90] verb="GET" URI="/apis/coordination.k8s.io/v1/namespaces/kube-system/leases/kube-controller-manager?timeout=10s" latency=32.443867ms resp=200 UserAgent="k3s/v1.18.8+k3s1 (linux/arm) kubernetes/6b59531/leader-election" srcIP="127.0.0.1:50944":
Sep 23 20:01:11 pi04 k3s[2957]: I0923 20:01:11.818910    2957 httplog.go:90] verb="GET" URI="/apis/coordination.k8s.io/v1/namespaces/kube-system/leases/kube-scheduler?timeout=10s" latency=31.083158ms resp=200 UserAgent="k3s/v1.18.8+k3s1 (linux/arm) kubernetes/6b59531/leader-election" srcIP="127.0.0.1:50942":
Sep 23 20:01:11 pi04 k3s[2957]: I0923 20:01:11.850859    2957 prober.go:133] Readiness probe for "traefik-758cd5fc85-2dw2z_kube-system(6da4bd7e-8d80-4031-b71e-3541b30063b0):traefik" succeeded
Sep 23 20:01:11 pi04 k3s[2957]: I0923 20:01:11.976035    2957 httplog.go:90] verb="PUT" URI="/api/v1/namespaces/kube-system/endpoints/kube-scheduler?timeout=10s" latency=155.174368ms resp=200 UserAgent="k3s/v1.18.8+k3s1 (linux/arm) kubernetes/6b59531/leader-election" srcIP="127.0.0.1:50942":
Sep 23 20:01:11 pi04 k3s[2957]: I0923 20:01:11.976070    2957 httplog.go:90] verb="PUT" URI="/api/v1/namespaces/kube-system/endpoints/kube-controller-manager?timeout=10s" latency=157.059533ms resp=200 UserAgent="k3s/v1.18.8+k3s1 (linux/arm) kubernetes/6b59531/leader-election" srcIP="127.0.0.1:50944":
Sep 23 20:01:11 pi04 k3s[2957]: I0923 20:01:11.996951    2957 httplog.go:90] verb="GET" URI="/apis/coordination.k8s.io/v1/namespaces/kube-system/leases/kube-scheduler?timeout=10s" latency=18.381827ms resp=200 UserAgent="k3s/v1.18.8+k3s1 (linux/arm) kubernetes/6b59531/leader-election" srcIP="127.0.0.1:50942":
Sep 23 20:01:11 pi04 k3s[2957]: I0923 20:01:11.998867    2957 httplog.go:90] verb="GET" URI="/apis/coordination.k8s.io/v1/namespaces/kube-system/leases/kube-controller-manager?timeout=10s" latency=20.373344ms resp=200 UserAgent="k3s/v1.18.8+k3s1 (linux/arm) kubernetes/6b59531/leader-election" srcIP="127.0.0.1:50944":
Sep 23 20:01:12 pi04 k3s[2957]: I0923 20:01:12.031955    2957 httplog.go:90] verb="GET" URI="/api/v1/namespaces/kube-system/endpoints/cloud-controller-manager" latency=21.399944ms resp=200 UserAgent="k3s/v1.18.8+k3s1 (linux/arm) kubernetes/6b59531/leader-election" srcIP="127.0.0.1:50946":
Sep 23 20:01:12 pi04 k3s[2957]: I0923 20:01:12.054114    2957 httplog.go:90] verb="GET" URI="/apis/coordination.k8s.io/v1/namespaces/kube-system/leases/cloud-controller-manager" latency=20.474379ms resp=200 UserAgent="k3s/v1.18.8+k3s1 (linux/arm) kubernetes/6b59531/leader-election" srcIP="127.0.0.1:50946":
Sep 23 20:01:12 pi04 k3s[2957]: I0923 20:01:12.121568    2957 httplog.go:90] verb="PUT" URI="/apis/coordination.k8s.io/v1/namespaces/kube-system/leases/kube-controller-manager?timeout=10s" latency=121.114056ms resp=200 UserAgent="k3s/v1.18.8+k3s1 (linux/arm) kubernetes/6b59531/leader-election" srcIP="127.0.0.1:50944":
Sep 23 20:01:12 pi04 k3s[2957]: I0923 20:01:12.121745    2957 httplog.go:90] verb="PUT" URI="/apis/coordination.k8s.io/v1/namespaces/kube-system/leases/kube-scheduler?timeout=10s" latency=123.100423ms resp=200 UserAgent="k3s/v1.18.8+k3s1 (linux/arm) kubernetes/6b59531/leader-election" srcIP="127.0.0.1:50942":
Sep 23 20:01:12 pi04 k3s[2957]: I0923 20:01:12.194719    2957 httplog.go:90] verb="PUT" URI="/api/v1/namespaces/kube-system/endpoints/cloud-controller-manager" latency=138.934536ms resp=200 UserAgent="k3s/v1.18.8+k3s1 (linux/arm) kubernetes/6b59531/leader-election" srcIP="127.0.0.1:50946":
Sep 23 20:01:12 pi04 k3s[2957]: I0923 20:01:12.216255    2957 httplog.go:90] verb="GET" URI="/apis/coordination.k8s.io/v1/namespaces/kube-system/leases/cloud-controller-manager" latency=19.72485ms resp=200 UserAgent="k3s/v1.18.8+k3s1 (linux/arm) kubernetes/6b59531/leader-election" srcIP="127.0.0.1:50946":
Sep 23 20:01:12 pi04 k3s[2957]: I0923 20:01:12.423531    2957 httplog.go:90] verb="GET" URI="/api/v1/namespaces/kube-system/configmaps/k3s" latency=20.061588ms resp=200 UserAgent="k3s/v1.18.8+k3s1 (linux/arm) kubernetes/6b59531" srcIP="127.0.0.1:50854":
Sep 23 20:01:12 pi04 k3s[2957]: I0923 20:01:12.434408    2957 httplog.go:90] verb="PUT" URI="/apis/coordination.k8s.io/v1/namespaces/kube-system/leases/cloud-controller-manager" latency=216.396787ms resp=200 UserAgent="k3s/v1.18.8+k3s1 (linux/arm) kubernetes/6b59531/leader-election" srcIP="127.0.0.1:50946":
Sep 23 20:01:12 pi04 k3s[2957]: I0923 20:01:12.654247 2957 httplog.go:90] verb="PUT" URI="/api/v1/namespaces/kube-system/configmaps/k3s" latency=228.852009ms resp=200 UserAgent="k3s/v1.18.8+k3s1 (linux/arm) kubernetes/6b59531" srcIP="127.0.0.1:50854":Interesting, I know the control loop is checking state to keep it as wanted, but there is maybe some optimization where on low-end systems the intervals can be longer?
brandond
commented
4 years ago These requests are happening all the time, you're seeing them logged because the request latency is over 100ms. This usually means that your database is on slow storage or does not have sufficient cpu.
sraillard
commented
4 years ago @brandond: @tim-brand wrote that he has enabled verbose logging, so maybe all the requests are logged even if there are under 100ms response time.
tim-brand
commented
4 years ago Yes, that's correct, they only get logged when I enable the verbose logging, using -v 6
I just reinstalled my rpi4, this time with the hypriot image, which includes docker and some optimalisations. Then I installed/started k3s with the --docker option. I now see that almost all cpu resources that are being used, are only coming from the k3s processes. Also checked docker stats which shows me that all the containers are running at 0.50% CPU or below.
tim-brand
commented
4 years ago I installed Ubuntu Server with Microk8s, and it's also having a high idle load. From what I can see now the load is a bit lower than with k3s, but still about 1.60 average. So I'm starting to thing the 'default' load is because of the status and health checks of k8s.
sraillard
commented
4 years ago No k3s maintainer can help us on understanding these consumed resources?
brandond
commented
4 years ago Here's what my pi4b looks like with an external MariaDB database backend; I don't have one running with sqlite at the moment.
Tasks: 150 total,   1 running, 149 sleeping,   0 stopped,   0 zombie
%Cpu(s):  2.1 us,  1.3 sy,  0.0 ni, 96.4 id,  0.0 wa,  0.0 hi,  0.2 si,  0.0 st
MiB Mem :   3793.3 total,    752.8 free,   1283.4 used,   1757.1 buff/cache
MiB Swap:      0.0 total,      0.0 free,      0.0 used.   2692.5 avail Mem

    PID USER      PR  NI    VIRT    RES    SHR S  %CPU  %MEM     TIME+ COMMAND
    874 root      20   0 1235084 541524  83436 S  12.6  13.9   5526:57 k3s-server
    889 root      20   0  813640 134020  70096 S   1.0   3.5 413:30.53 containerd
   2241 root      20   0  743496  46852  28468 S   0.7   1.2 138:51.05 coredns
   2464 nobody    20   0  731852  39308  21040 S   0.7   1.0 233:01.06 kube-state-metr
sysadm@pi01:~$ w
23:08:29 up 17 days, 11:31, 1 user, load average: 0.30, 0.61, 0.53
sysadm@pi01:~$ cat /etc/os-release
NAME="Ubuntu"
VERSION="20.10 (Groovy Gorilla)"
ID=ubuntu
ID_LIKE=debian
PRETTY_NAME="Ubuntu Groovy Gorilla (development branch)"
VERSION_ID="20.10"
HOME_URL="https://www.ubuntu.com/"
SUPPORT_URL="https://help.ubuntu.com/"
BUG_REPORT_URL="https://bugs.launchpad.net/ubuntu/"
PRIVACY_POLICY_URL="https://www.ubuntu.com/legal/terms-and-policies/privacy-policy"
VERSION_CODENAME=groovy
UBUNTU_CODENAME=groovy
sysadm@pi01:~$ uname -a
Linux pi01.lan.khaus 5.4.0-1018-raspi #20-Ubuntu SMP Sun Sep 6 05:11:16 UTC 2020 aarch64 aarch64 aarch64 GNU/Linux
sysadm@pi01:~$ cat /etc/fstab
LABEL=writable / ext4 defaults,noatime,commit=3600 0 0
LABEL=system-boot /boot/firmware vfat defaults 0 1
ysadm@pi01:~$ cat /etc/systemd/journald.conf
[Journal]
Storage=volatile
sysadm@pi01:~$ cat /etc/default/flash-kernel
LINUX_KERNEL_CMDLINE="apparmor=0 mitigations=off cgroup_memory=1 cgroup_enable=memory max_loop=32"Here's what my pi4b looks like with an external MariaDB database backend; I don't have one running with sqlite at the moment.
sysadm@pi01:~$ w

 23:08:29 up 17 days, 11:31,  1 user,  load average: 0.30, 0.61, 0.53
That's a good load. What OS and version of k3s are you using?
I've runned k3s with mariadb myself, but with a much higher idle load.
tim-brand
commented
4 years ago Also, I've installed "plain" kubernetes on Ubuntu 20.04 at my Pi4b, where I notice also and idle load of about 1.40 resulted by the kube-apiserver
brandond
commented
4 years ago I've updated to add some details. I tweaked the fstab mount options and journald settings to reduce writes to the SD card, as well as disabling apparmor and cpu vulnerability mitigations. Not sure how much of a difference that makes, but you might give it a try.
 icebrian
commented
4 years ago
icebrian
commented
4 years ago Also seeing this behaviour. Here are details of my clean installation, with no workers:
Hardware: Raspberry Pi 4 8GB OS: Raspberry OS 64bit (Booting from external SSD)
Did the following to install: Added "cgroup_enable=cpuset cgroup_enable=memory cgroup_memory=1" to /boot/cmdline.txt
Changed to legacy iptables:
update-alternatives --set iptables /usr/sbin/iptables-legacy
update-alternatives --set ip6tables /usr/sbin/ip6tables-legacy
Set following env. vars to install:
export K3S_KUBECONFIG_MODE="644"
export INSTALL_K3S_EXEC=" --no-deploy servicelb --no-deploy traefik"
Waited 3hrs, no additional deployments and load average was: 1.17, 1.08, 1.07. Whilst looking at top I can see k3s-server jumping between 6% and 20% (sometimes up to 25%) with it mostly at arround 14-16%.
brandond
commented
4 years ago Yes @icebrian that sounds about right.
sraillard
commented
4 years ago @brandond Regarding the control loops and all the internal processing, I have installed the latest k3s disabling nearly everything I can with this command line:
curl -sfL https://get.k3s.io | INSTALL_K3S_CHANNEL=latest INSTALL_K3S_EXEC="server --flannel-backend=none --disable=traefik --disable=local-storage --disable=metrics-server --disable=coredns --disable-scheduler --disable-cloud-controller --disable-network-policy" sh -
The version installed is v1.19.2+k3s1.
There are no pods scheduled, no scheduler, no flannel, no network policy, no cloud controller and I still have the same CPU usage around 25%:

brandond
commented
4 years ago Most of those --disable flags remove packaged components that run in their own pods, not within the k3s process. The other items you've disabled (cloud controller and scheduler) don't contribute significantly to utilization except when new nodes or pods are being added. While disabling packaged components may reduce your overall system CPU utilization, it does not make any meaningful difference in the amount of work that k3s has to do.
Is there a specific problem that you're trying to solve, other than just wanting to make the numbers smaller?
sraillard
commented
4 years ago To be honest, it's a kind of curiosity where I like to understand why the resources are used and if there is any room for some optimizations (maybe because I used to code in assembly and fight for each CPU cycle :smile:!)
In practice, we have real edge computing cases where I think k3s can be a really good option but the hardware we have is really limited in CPU and memory. We should have enough room for our application as the idle k3s server is roughly using one quart of a core on a CPU having 4 cores and 500MB of memory over 2GB.
Regarding the modern servers performance, it may be not a point of interest, but I was thinking than one usage of k3s can be these small industrial servers. I may be wrong on that product vision.
 bemanuel
commented
4 years ago
bemanuel
commented
4 years ago I'm with the same problem
k3s version v1.18.9+k3s1 (630bebf9)
Ubuntu 20.04.1 LTS
Running Rancher 2.4.8

tim-brand
commented
3 years ago I've been running a cluster for some time now, and the high load is only related to the master nodes. I added some worker nodes and they have a low idle load. The master nodes are excused for work at my cluster, so dedicated to control the cluster. I really think this is expected behaviour.
brandond
commented
3 years ago I did some unofficial baselining a while back, but the tl;dr is that it takes a fair bit of memory to do all the things that Kubernetes does - even if you're not using all the features , the code is still there and running. We've cut out and shared as much as we can while still leaving a functional and standards-compliant Kubernetes distribution. The more features you use, and the more resources you create, the more CPU time and memory you will need to support those operations.
https://gist.github.com/brandond/32f8c4846b9f71d6c145c26afced7ed8
bemanuel
commented
3 years ago I did some unofficial baselining a while back, but the tl;dr is that it takes a fair bit of memory to do all the things that Kubernetes does - even if you're not using all the features , the code is still there and running. We've cut out and shared as much as we can while still leaving a functional and standards-compliant Kubernetes distribution. The more features you use, and the more resources you create, the more CPU time and memory you will need to support those operations.
https://gist.github.com/brandond/32f8c4846b9f71d6c145c26afced7ed8 I'll collect data and send ASAP.
sraillard
commented
3 years ago I have done new tests, and as I'm using a CentOS 7, I have even tested a kernel upgrade from 3.10 to 5.x (that didn't change anything).
Regarding resources usage, a basic v1.19.3+k3s1 fresh installation will use around 600MB of memory and 700MB of disk.
For the CPU usage, regarding the Kubernetes inner workings, this should be divided in:
I'm wondering if there is any way to reduce the impact of the kubelet and kube-controller-manager processes by decreasing their reconciliation intervals? Anyone knows if there are some parameters to play with to make them less reactive?
 mangelajo
commented
3 years ago
mangelajo
commented
3 years ago Same here on rpi4 / raspbian, with the cgroups and iptables changes applied:

while the cluster is sitting idle .
 geogeim
commented
3 years ago
geogeim
commented
3 years ago same here, debian testing fresh install eating 15-20% cpu without any pods
mangelajo
commented
3 years ago @Oats87 do you know who can we ask for some eyes on this?
 ngrilly
commented
3 years ago
ngrilly
commented
3 years ago Is there a specific problem that you're trying to solve, other than just wanting to make the numbers smaller?
@brandond When k3s is used for edge/IoT applications, then power consumption is important because these systems are often running on batteries.
sraillard
commented
3 years ago If k3s is targeting edge computing, and I understand it is, you have also to take into account the edge computing environment.
You may have rugged computers that doesn't have the same performance as a normal server by current standard.
Having an orchestrator already eating a lot of resources (on a small server platform for edge computing) even before deploying the first application is making me think if this is a valid option.
ngrilly
commented
3 years ago @sraillard This is exactly what surprises me when I read about people using k8s and k3s for IoT/edge projects. The computers we're using at the edge are much less powerful than my laptop.
mangelajo
commented
3 years ago Interesting, I know the control loop is checking state to keep it as wanted, but there is maybe some optimization where on low-end systems the intervals can be longer?
I suspect something like this would be the solution
brandond
commented
3 years ago We've added some resource profiling figures to our documentation, feel free to take a look: https://rancher.com/docs/k3s/latest/en/installation/installation-requirements/resource-profiling/
FWIW, when we talk about edge we usually mean things like cell towers, stores, restaurants, forward operating bases, etc. While K3s has been designed to optimize CPU and memory utilization compared to other Kubernetes distributions, there will probably continue to be many extreme low-end use cases (including mobile, battery-backed operation) in which the overhead of a complex control plane is not desirable.
onedr0p
commented
3 years ago Excellent documentation @brandond thanks for sharing!
sraillard
commented
3 years ago @brandond thank you for sharing your tests and I agree that edge computing may need some clarification as it's a very broad definition. In our case, it could be seen as rugged, standalone, low-spec server.
Environmental Info: K3s Version: k3s version v1.18.8+k3s1 (6b595318)
Running on CentOS 7.8
Node(s) CPU architecture, OS, and Version: Linux k3s 3.10.0-1127.19.1.el7.x86_64 #1 SMP Tue Aug 25 17:23:54 UTC 2020 x86_64 x86_64 x86_64 GNU/Linux
AMD GX-412TC SOC with 2GB RAM
Cluster Configuration: Single node installation
Describe the bug:
When deploying the latest stable k3s on a single node, the CPU and memory usage may look important. I understand that Kubernetes isn't lightweight by definition, but the k3s is really interessing for creating/deploying appliances. On small (embedded) systems, the default CPU and memory usage is important (I'm not speaking here for modern servers). Is-there a way to optimize these ressources usage or at least to understand the k3s usage of ressources when nothing is deployed?
Steps To Reproduce:
curl -sfL https://get.k3s.io | INSTALL_K3S_EXEC="server --no-deploy traefik" sh
Expected behavior:
Maybe less CPU and memory usage when nothing is deployed and running
Actual behavior:
500MB of memory used and 5% of CPU usage on each core (4 cores CPU) when idle
Additional context / logs: