AutoDeploy


What is AutoDeploy?

A one liner : For the DevOps nerds, AutoDeploy allows configuration based MLOps.
For the rest : So you're a data scientist and have the greatest model on planet earth to classify dogs and cats! :). What next? It's a steeplearning cusrve from building your model to getting it to production. MLOps, Docker, Kubernetes, asynchronous, prometheus, logging, monitoring, versioning etc. Much more to do right before you The immediate next thoughts and tasks are
- How do you get it out to your consumer to use as a service.
- How do you monitor its use?
- How do you test your model once deployed? And it can get trickier once you have multiple versions of your model. How do you perform A/B testing?
- Can i configure custom metrics and monitor them?
- What if my data distribution changes in production - how can i monitor data drift?
- My models use different frameworks. Am i covered? ... and many more.
Architecture

What if you could only configure a single file and get up and running with a single command. That is what AutoDeploy is!
Read our documentation to know how to get setup and get to serving your models.
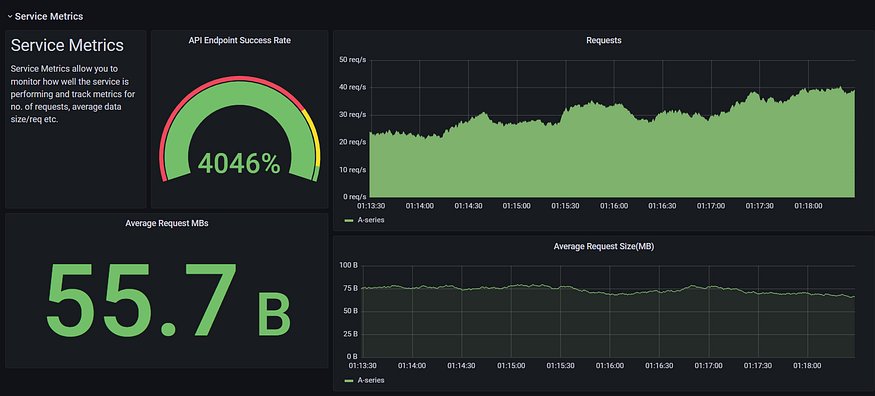
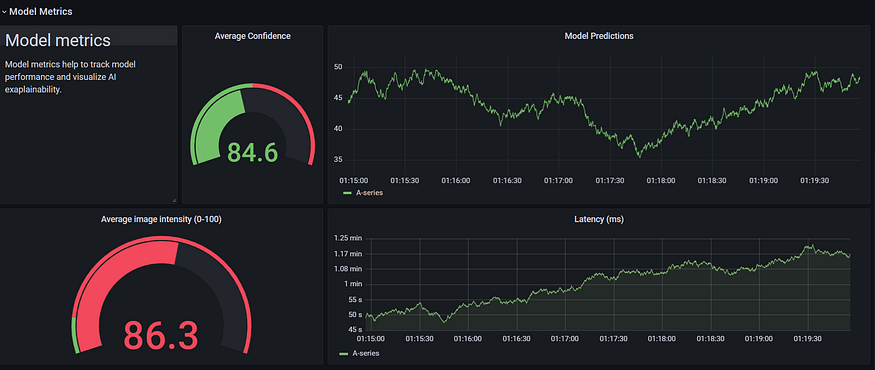
AutoDeploy monitoring dashboard
and many more...
Feature Support.
- [x] Single Configuration file support.
- [x] Enterprise deployment architecture.
- [x] Logging.
- [x] Grafana Dashboards.
- [x] Dynamic Database.
- [x] Data Drift Monitoring.
- [x] Async Model Monitoring.
- [x] Network traffic monitoring.
- [x] Realtime traffic simulation.
- [x] Autoscaling of services.
- [x] Kubernetes.
- [x] Preprocess configuration.
- [x] Posprocess configuration.
- [x] Custom metrics configuration.
Prerequisites
-
Install docker
- For Ubuntu (and Linux distros) - Install Docker on Ubuntu
- For Windows - Install Docker on Windows
- For Mac -
-
Install docker-compose
- For Ubuntu (and Linux distros) - Install docker-compose on Linux
- For Windows and Mac
Steps
- Clone the repo : https://github.com/kartik4949/AutoDeploy
- Download a sample model and dependencies
- Run the command in a terminal from the AutoDeploy folder
wget https://github.com/kartik4949/AutoDeploy/files/7134516/model_dependencies.zip
- Run the command in a terminal from the AutoDeploy folder
- Extract the zip folder to get a model_dependencies folder
- Have your model ready
- Pickle file for scikitlearn
- ONNX model for Tensorflow,Pytorch, MXNet etc. How to convert to ONNX model
- Create the model dependencies
- Copy the dependencies over to a model_dependencies folder
- Setup configuration
- Steps for Docker deployment
- Build your docker image
bash build.sh -r path/to/model/requirements.txt -c path/to/model/config.yaml- Start your containers
bash start.sh -f path/to/config/file/in/autodeploy
- Steps for Kubernetes
- Build your docker image
bash build.sh -r path/to/model/requirements.txt -c path/to/model/config.yaml- Apply kubeconfig files
kubectl -f k8s apply- Print all pods
kubectl get pod- Port forwarding of api and grafana service
kubectl port-forward autodeploy-pod-name 8000:8000kubectl port-forward grafana-pod-name 3000:3000
Example (Docker deployment) - Iris Model Detection (Sci-Kit Learn).
-
Clone repo.
-
Dump your iris sklearn model via pickle, lets say
custom_model.pkl. -
Make a dir model_dependencies inside AutoDeploy.
-
Move
custom_model.pklto model_dependencies. -
Create or import a reference
iris_reference.npyfile for data drift monitoring.- Note:
iris_reference.npyis numpy reference array used to find drift in incomming data. - This reference data is usually in shape
(n, *shape_of_input)e.g for iris data : np.zeros((100, 4)) - Shape (100, 4) means we are using 100 data points as reference for incomming input request.
- Note:
-
Move
iris_reference.npyto model_dependencies folder. -
Refer below config file and make changes in configs/iris/config.yaml and save it.
-
Lastly make an empty reqs.txt file inside model_dependencies folder.
model: model_type: 'sklearn' model_path: 'custom_model.pkl' # Our model pickle file. model_file_type: 'pickle' version: '1.0.0' model_name: 'sklearn iris detection model.' endpoint: 'predict' protected: 0 input_type: 'structured' server: name: 'autodeploy' port: 8000 dependency: path: '/app/model_dependencies' input_schema: petal_length: 'float' petal_width: 'float' sepal_length: 'float' sepal_width: 'float' out_schema: out: 'int' probablity: 'float' status: 'int' monitor: server: name: 'rabbitmq' port: 5672 data_drift: name: 'KSDrift' reference_data: 'iris_reference.npy' type: 'info' metrics: average_per_day: type: 'info' -
run
bash build.sh -r model_dependencies/reqs.txt -c configs/iris/config.yaml -
run
bash start.sh -f configs/iris/config.yaml
Tada!! your model is deployed.
Example (Docker deployment) - Classification Detection
- Clone repo.
- Convert the model to Onnx file
model.onnx. - Make a dir model_dependencies inside AutoDeploy.
- Move
model.onnxto model_dependencies. - Create or import a reference
classification_reference.npyfile for data drift monitoring. - Move
classification_reference.npyto model_dependencies folder. - Refer below config file and make changes in configs/iris/config.yaml and save it.
model:
        model_type: 'onnx'
        model_path: 'horse_zebra.onnx'
        model_file_type: 'onnx'
        version: '1.0.0'
        model_name: 'computer vision classification model.'
        endpoint: 'predict'
        protected: 0
        input_type: 'serialized'
        input_shape: [224, 224, 3]
        server:
                name: 'autodeploy'
                port: 8000
preprocess: 'custom_preprocess_classification'
input_schema:
        input: 'string'
out_schema:
        out: 'int'
        probablity: 'float'
        status: 'int'
dependency:
        path: '/app/model_dependencies'
monitor:
        server:
                name: 'rabbitmq'
                port: 5672
        data_drift:
                name: 'KSDrift'
                reference_data: 'structured_ref.npy'
                type: 'info'
        custom_metrics: 'image_brightness'
        metrics:
                average_per_day:
                        type: 'info'
-
Make a reqs.txt file inside model_dependencies folder.
-
reqs.txt
pillow -
Make preprocess.py
import cv2
import numpy as np
from register import PREPROCESS
@PREPROCESS.register_module(name='custom_preprocess') def iris_pre_processing(input): return input
@PREPROCESS.register_module(name='custom_preprocess_classification') def custom_preprocess_fxn(input): _channels = 3 _input_shape = (224, 224) _channels_first = 1 input = cv2.resize( input[0], dsize=_input_shape, interpolation=cv2.INTER_CUBIC) if _channels_first: input = np.reshape(input, (_channels, _input_shape)) else: input = np.reshape(input, (_input_shape, _channels)) return np.asarray(input, np.float32)
- Make postproces.py
from register import POSTPROCESS
@POSTPROCESS.register_module(name='custom_postprocess') def custom_postprocess_fxn(output): out_class, out_prob = output[0], output[1] output = {'out': output[0], 'probablity': output[1], 'status': 200} return output
- Make custom_metrics.py we will make a custom_metric to expose image_brightnessimport numpy as np from PIL import Image from register import METRICS
@METRICS.register_module(name='image_brightness') def calculate_brightness(image): image = Image.fromarray(np.asarray(image[0][0], dtype='uint8')) greyscale_image = image.convert('L') histogram = greyscale_image.histogram() pixels = sum(histogram) brightness = scale = len(histogram)
for index in range(0, scale): ratio = histogram[index] / pixels brightness += ratio * (-scale + index)
return 1.0 if brightness == 255 else brightness / scale
- run ``` bash build.sh -r model_dependencies/reqs.txt -c configs/classification/config.yaml ```
- run ``` bash start.sh -f configs/classification/config.yaml ```
- To monitor the custom metric `image_brightness`: goto grafana and add panel to the dashboard with image_brightness as metric.

## After deployment steps
### Model Endpoint
- http://address:port/endpoint is your model endpoint e.g http://localhost:8000/predict

### Grafana
- Open http://address:3000
- Username and password both are `admin`.
- Goto to add datasource.
- Select first option prometheus.
- Add http://prometheus:9090 in the source
- Click save and test at bottom.
- Goto dashboard and click import json file.
- Upload dashboard/model.json avaiable in repository.
- Now you have your dashboard ready!! feel free to add more panels with queries.

## Preprocess
- Add preprocess.py in model_dependencies folder
- from register module import PROCESS register, to register your preprocess functions.
from register import PREPROCESS
- decorate your preprocess function with `@PREPROCESS.register_module(name='custom_preprocess')`@PREPROCESS.register_module(name='custom_preprocess') def function(input):
process input
input = process(input) return input
- Remeber we will use `custom_preprocess` name in our config file, add this in your config file.preprocess: custom_preprocess
## Postprocess
- Same as preprocess
- Just remember schema of output from postprocess method should be same as definde in config file
- i.e
out_schema: out: 'int' probablity: 'float' status: 'int'
## Custom Metrics
- from register import METRICS
- register your function with METRIC decorator similar to preprocess
- Example 1 : Simple single metric
import numpy as np from PIL import Image from register import METRICS
@METRICS.register_module(name='image_brightness') def calculate_brightness(image): image = Image.fromarray(np.asarray(image[0][0], dtype='uint8')) greyscale_image = image.convert('L') histogram = greyscale_image.histogram() pixels = sum(histogram) brightness = scale = len(histogram)
for index in range(0, scale): ratio = histogram[index] / pixels brightness += ratio * (-scale + index)
return 1.0 if brightness == 255 else brightness / scale
- We will use `image_brightness` in config file to expose this metric function.monitor: server: name: 'rabbitmq' port: 5672 data_drift: name: 'KSDrift' reference_data: 'structured_ref.npy' type: 'info' custom_metrics: ['metric1', 'metric2'] metrics: average_per_day: type: 'info'
- Example 2: Advance metric with multiple metrcis functions
import numpy as np from PIL import Image from register import METRICS
@METRICS.register_module(name='metric1') def calculate_brightness(image): return 1
@METRICS.register_module(name='metric2') def metric2(image): return 2
- config looks likemonitor: server: name: 'rabbitmq' port: 5672 data_drift: name: 'KSDrift' reference_data: 'structured_ref.npy' type: 'info' custom_metrics: ['metric1', 'metric2'] metrics: average_per_day: type: 'info'
<!-- LICENSE -->
## License

Distributed under the MIT License. See `LICENSE` for more information.

<!-- CONTACT -->
## Contact

Kartik Sharma  - kartik4949@gmail.com
Nilav Ghosh - nilavghosh@gmail.com