mxgraph-editor
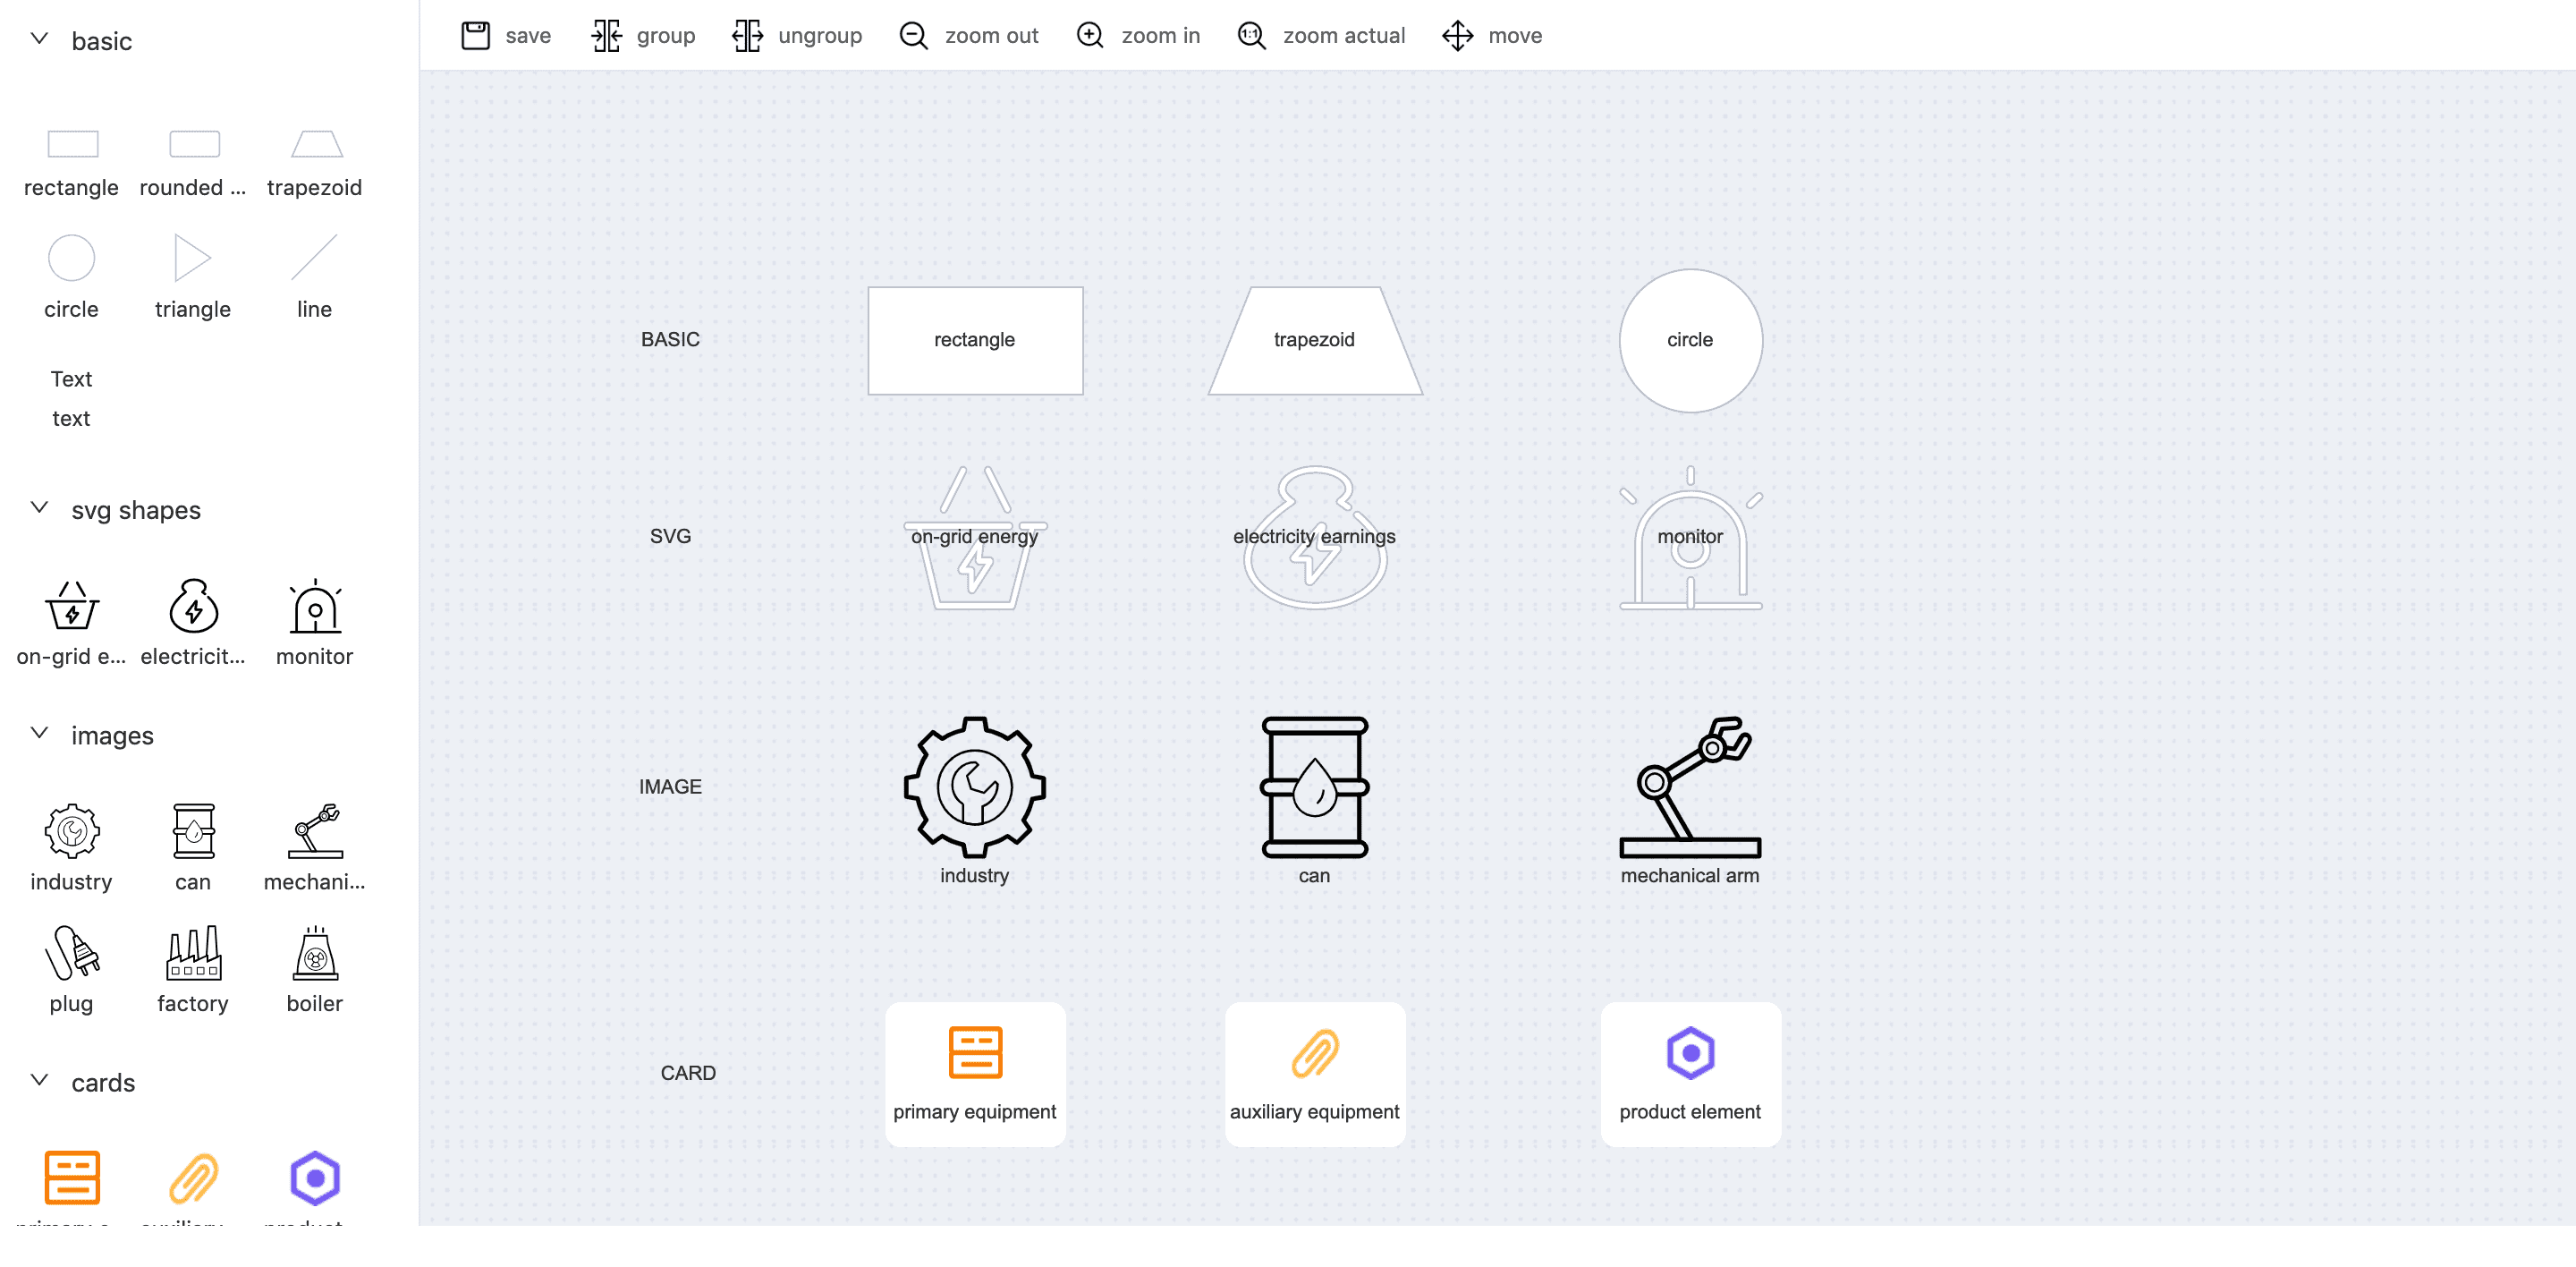
A mxGraph editor support 3 types of shapes, svg/image/card.

development
npm install

npm start
install
npm install --save mxgraph-editordemo
See the detail in ./demo .
start the demo
// start the demo
npm start
code
import Sidebar from './sidebar';
import Toolbar from './toolbar';

import IMAGE_SHAPES from './shape-config/image-shape';
import CARD_SHAPES from './shape-config/card-shape';
import SVG_SHAPES from './shape-config/svg-shape.xml';

import Editor from 'mxgraph-editor';

const editor = new Editor({
    container: '.graph-content',
    clickFunc: this.clickFunc,
    doubleClickFunc: this.doubleClickFunc,
    autoSaveFunc: this.autoSaveFunc,
    cellCreatedFunc: this.cellCreatedFunc,
    deleteFunc: this.deleteFunc,
    valueChangeFunc: this.valueChangeFunc,
    IMAGE_SHAPES,
    CARD_SHAPES,
    SVG_SHAPES
  });

 render() {
    return (
      <div className="editor-container">
        <Layout>
          <Sider width="235" theme="light">
            <Sidebar key="sidebar" graph={this.editor} />
          </Sider>
          <Content>
            <div className="graph-inner-container">
              <Toolbar
                graph={this.editor}
                updateDiagramData={this.updateDiagramData}
              />
              <div className="graph-content" key="graphcontent" />
            </div>
          </Content>
        </Layout>
      </div>
    );
  }
api
| property | description | type | default |
|---|---|---|---|
| SVG_SHAPES | SVG shapes config | Array | [] |
| CARD_SHAPES | card shapes config | Array | [] |
| IMAGE_SHAPES | image shapes config | Array | [] |
| container | container dom selector | selector | |
| clickFunc | click event callback | function(cell) | |
| doubleClickFunc | double click event callback | function(cell) | |
| autoSaveFunc | auto save callback | function(xml) | |
| cellCreatedFunc | cell created callback | function(cell) | |
| deleteFunc | cell delete callback | function(e) | |
| valueChangeFunc | cell value change callback | function(value) | |
| initSidebar | init the sidebar | function(elements) | |
| initCustomPort | the custom port, 10x10px | function((picture)) | |
| zoom | zoom | function(type),input params:in(zoom in)、out(zoom out)、actual(zoom actual) | |
| updateStyle | update style | function(cell, key, value),input params:cell,key (the key of style),value (the value of style) | |
| groupCells | group cells | function(groupId, labelName),input params:groupId(group id),name (group label) | |
| ungroupCells | ungroup cells | function(cells) | |
| getCellsSelected | get all cells selected | function() | |
| getGraphXml | get the xml of graph | function() | |
| createVertex | create vertex | function(shapeLabel, x, y, width, height, shapeStyle) | |
| insertEdge | insert edge | function(vertex1, vertex2) | |
| getCellById | get cell by id | function(id) | |
| getAllCells | get all cells | function() | |
| refresh | refresh the graph | function() | |
| clearSelection | clear the selection in the graph | function() | |
| startPanning | start panning | function() | |
| stopPanning | stop panning | function() |