MMM-AVStock
MagicMirror module for displaying stock price using the Alphavantage API.
Screenshot
-
mode:table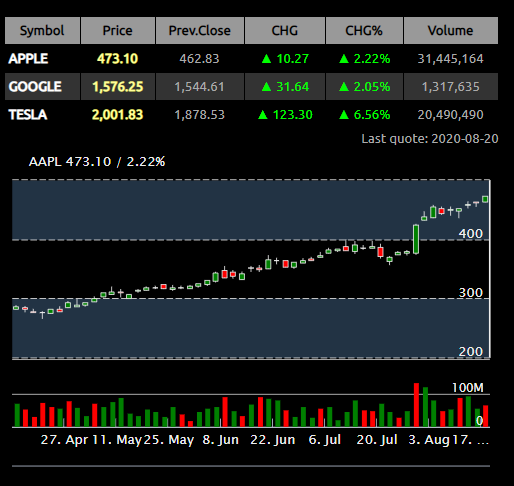
-
mode:ticker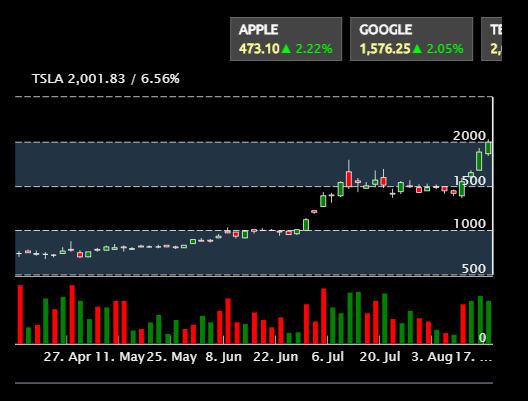
-
mode:gridwithdirection:'row'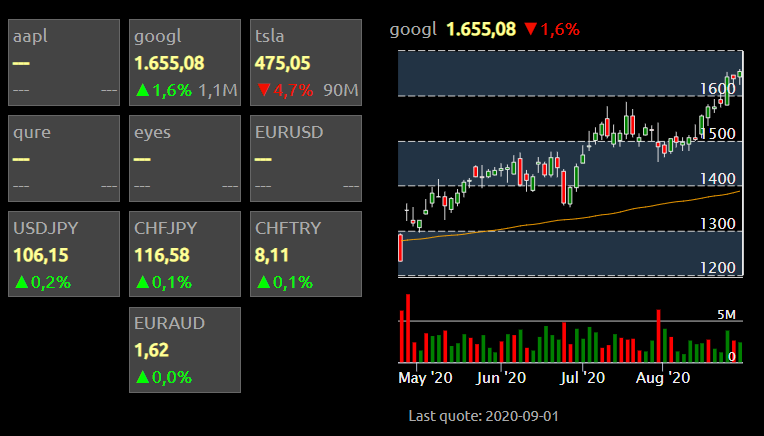
-
mode:ticker with own purchase prices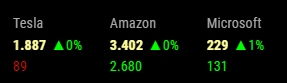
-
mode:ticker with own purchase prices and total performance compared to the purchase price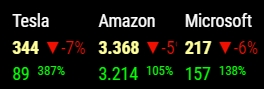
UPDATES
4.0.0
- complete switch to yfinance, no alphavantage key necessary
- cosmetic changes,esp. to ticker
3.0.0
- included yfinance for quote data (no login necessary)
- kept alphavantage (via npm module) for tech and historical data
- new DOM creation methods, should be more flexible now.
- changed tableHeader and tableHeaderTitles config outlay
2.3.1
- included
pureLineoption to remove axes and gridlines
2.3.0
- multi-table support. Use config option
maxTableRowsto show several table pages when symbol count exceeds maxTableRows. - improved
directiondescription. - added purchasePrice and perf2Purch to grid and table (thanks @spitzlbergerj)
- improved ticker and grid styling
2.2.0
- (by @spitzlbergerj) within the ticker mode, a line with the own purchase price and the display for profit and loss is added. The performance compared to the own purchase price can be displayed too.
- changed width scheme, hopefully fixing #35
- optimized tagline, now showing once below chart or table/grid/ticker
- code cleanup
- fixed ticker length (may fix ticker length issue): ticker can now expand over many items.
- optimized grid
2.1.0
- grid layout
- direction option to show chart besides other module
- improved styling
- fixed alias issue
2.0.0
- included Highcharts npm module for charts
- option to add chart (
mode: seriesstill available) - improved API calls
- technicals (EMA or SMA)
- touch functions (choose stock chart, zoom in chart)
Installation
cd ~/MagicMirror/modules
git clone https://github.com/lavolp3/MMM-AVStock
cd MMM-AVStock
npm install
Key
No Key needed anymore! Yay!
Configuration
Simple
{
  //disabled:true,
  module: "MMM-AVStock",
  position: "top_left",
  config: {
    symbols : ["AAPL", "GOOGL", "TSLA"],
    alias: ["APPLE", "GOOGLE", "TESLA"],
  }
},
Detailed
{
    module: "MMM-AVStock",
    position: "top_left", //"bottom_bar" is better for `mode:ticker`
    config: {
        timeFormat: "DD-MM HH:mm",
        width: null,
        symbols : ["AAPL", "GOOGL", "TSLA"],
        alias: ["APPLE", "GOOGLE", "TESLA"],
        purchasePrice: [123.45, 1234.56, 12.34],
        tickerDuration: 20,
        chartDays: 90,
        maxTableRows: null,
        mode : "table",                  // "table" or "ticker"
        showChart: true,
        pureLine: false,
        chartWidth: null,
        showVolume: true,
        chartInterval: "daily",          // choose from ["intraday", "daily", "weekly", "monthly"]
        decimals : 2,
        chartType: 'line',                // 'line', 'candlestick', or 'ohlc'
        alternateGridColor: '#223344',
        chartLineColor: '#eee',
        chartLabelColor: '#eee',
        coloredCandles: true,
        showPurchasePrices: true,
        showPerformance2Purchase: true,
        debug: false
    }
},
Configuration Options
| Option | Type | Default | Description |
|---|---|---|---|
mode |
string | 'table' | Use 'table' for table mode, 'ticker' for ticker mode, or 'grid' for a grid mode. |
width |
integer | null | Width of every module element. Sets the distinctive width of table, ticker, chart, or grid. If you keep this unchanged, width will be set to 100%. Apart from '100%', please use integer values! |
classes |
string | 'small' | Set classes known from module classes (xsmall, small, bright, dimmed etc.) |
direction |
string | 'row' | You can set row or column. setting row will place chart next to the table/grid/ticker as long as there is enough space available. Only works with width option set to a value |
timeFormat |
string | 'DD-MM HH:mm' | Format of dates to be shown. Use moment.js format style here |
symbols |
array | ["AAPL", "GOOGL", "TSLA"] | Array of stock symbols |
alias |
array | [] | Array of aliases to replace the stock symbol. Leave all or each empty to show the symbol name. |
maxTableRows |
integer | null | Set maximum table rows to paginate table with more symbols than rows. |
purchasePrice |
array of numbers | [] | Array of own purchase prices |
showPurchasePrices |
boolean | false | Whether to show the own purchase prices. |
showPerformance2Purchase |
boolean | false | Whether to show the total performace compared to the own purchase prices. |
tickerDuration |
integer | 20 | Determines ticker speed |
chartDays |
integer | 90 | Number of days to show in the chart. (Max 90 days!) |
showChart |
boolean | true | Whether to show the chart. |
alternateGridColor |
string | '#223344' | Use 3- or 6-digit hex numbers as strings here. Change to something like '#000' if you want to have a completely black chart. |
pureLine |
boolean | false | Set true to remove axes and gridlines (and volume) to show a pure line (or candlesticks) |
chartWidth |
integer | null | Determines width of chart, separate from overall width above |
chartInterval |
string | 'daily' | Chart interval. Currently only daily supported! |
showVolume |
boolean | true | Show volume bars in the chart. |
movingAverage |
object | { type: "SMA", periods: [200]} |
movingAverages to include in the graph. Use EMA or SMA type and an array of all moving averages you want to see. Consider that every MA uses an own API call. |
decimals |
integer | Number of decimals. | |
chartType |
string | line |
Use line, candlestick, or ohlc |
chartLineColor |
string | #eee |
Color of line chart |
chartLabelColor |
string | #eee |
Color of chart labels |
coloredCandles |
boolean | true | Whether to use colored candles or OHLC bars. |
debug |
boolean | false | Debug mode: additional output on server side (console) and client side (browser) |
ToDo
[x] Use another API! [x] Grid view [x] Support purchase Price in all modes [ ] Fix Volume bars (not showing correct colors due to highcharts' grouping function [ ] Support technicals (EMA, SMA)