D3 Bullet Chart Extension
Qlik Sense Extension for Dimensional Bullet Charts using D3
Project Description
This extension allows the user to create a bullet chart in Qlik Sense (using the D3.js library) that allows the user to visualize up to three measures across one or no dimensions. The linear gauge chart in Qlik Sense only allows for a maximum of two dimensions and does not allow the user to create a bar for each dimension. This project intends to provide the user with a much more extensive ;) charting option.
Installation Instructions
To use this extension, place the 'D3 Bullet Chart' folder in the directory C:\Users\%USERNAME%\Documents\Qlik\Sense\Extensions. Launch Qlik Sense and open an app, edit the app, and drag the 'D3 Bullet Chart' Chart Object into the sheet where you'd like it to appear. Add a dimension (optional) and at least one measure. Under the 'Chart Configuration' menu, there are a number of options to change colors and sizing of the various pieces of the chart.
There is also a sample application included in the folder, copy the file 'D3 Bullet Chart Sample App.qvf' into the directory C:\Users\%USERNAME%\Documents\Qlik\Sense\Apps then the application will appear in your Qlik Sense Hub. This sample app provides examples of how the extension can be altered to provide different looks.
Have fun!
Examples
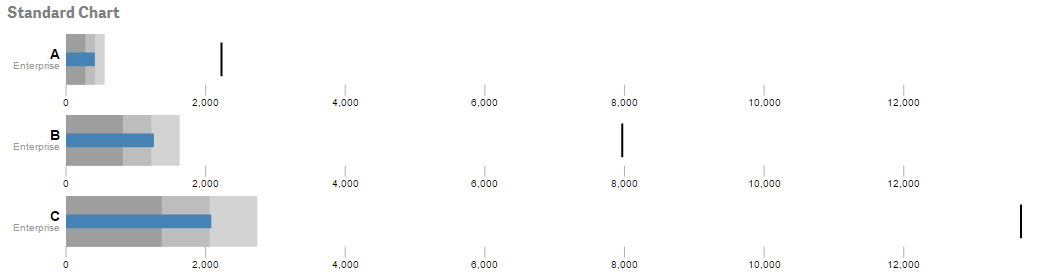
Standard example, basic colors with a uniform axis
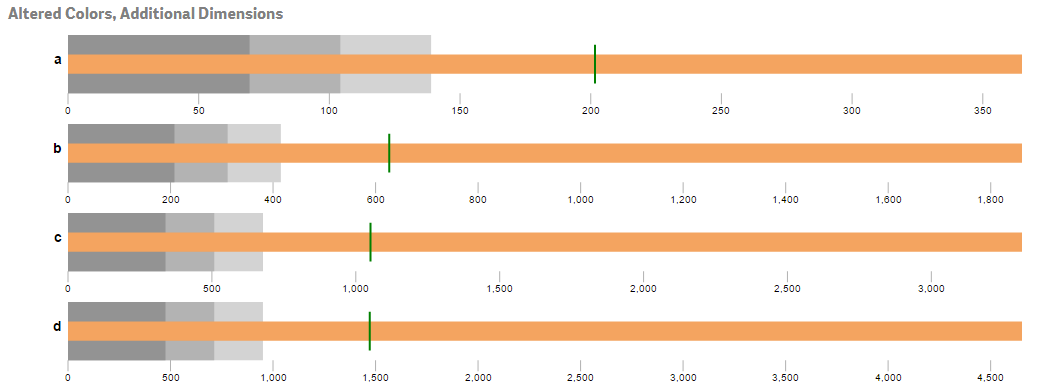
Example with altered colors and an independent axis
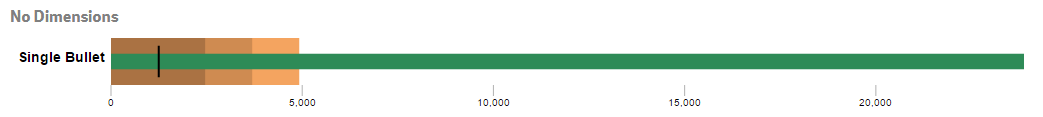
Bullet chart example with no dimensions
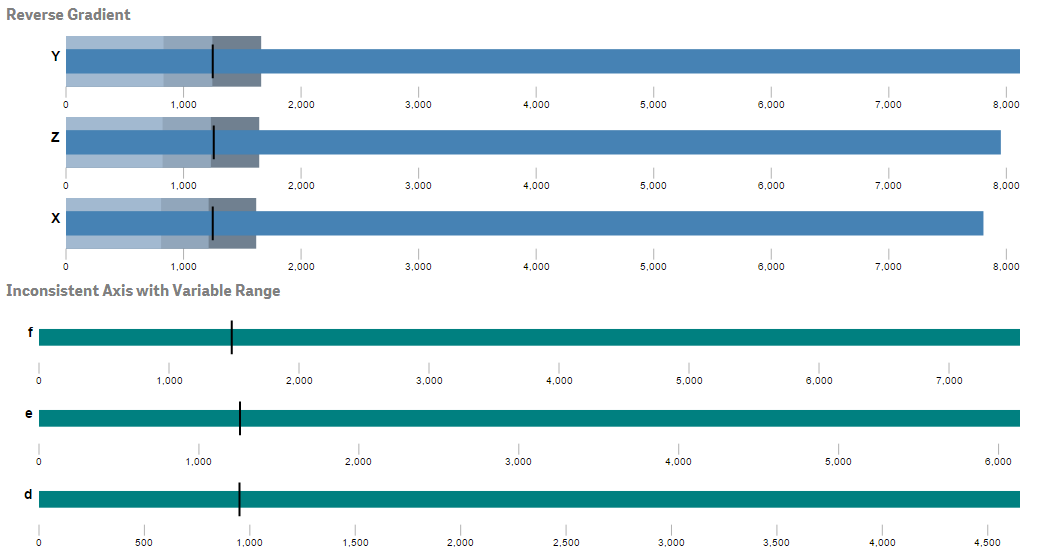
Two bullet charts with various configuration options shown
Extension Information
This extension was developed using a D3 example for bullet charts as a base. However, this extension allows you to add a dimension that will create multiple bullet charts within a single extension.
Author
Kevin McGovern
Contributions, Comments, Feedback & Questions
If you would like to contribute, have any questions, found any bugs, etc., please create an issue on GitHub.
Resources Used in this Extension
License
This extension is provided 'as is' under the MIT License.