vnstat-dashboard
Uses Bottle and Plotly JS to create some graphs to monitor data usage from a device.
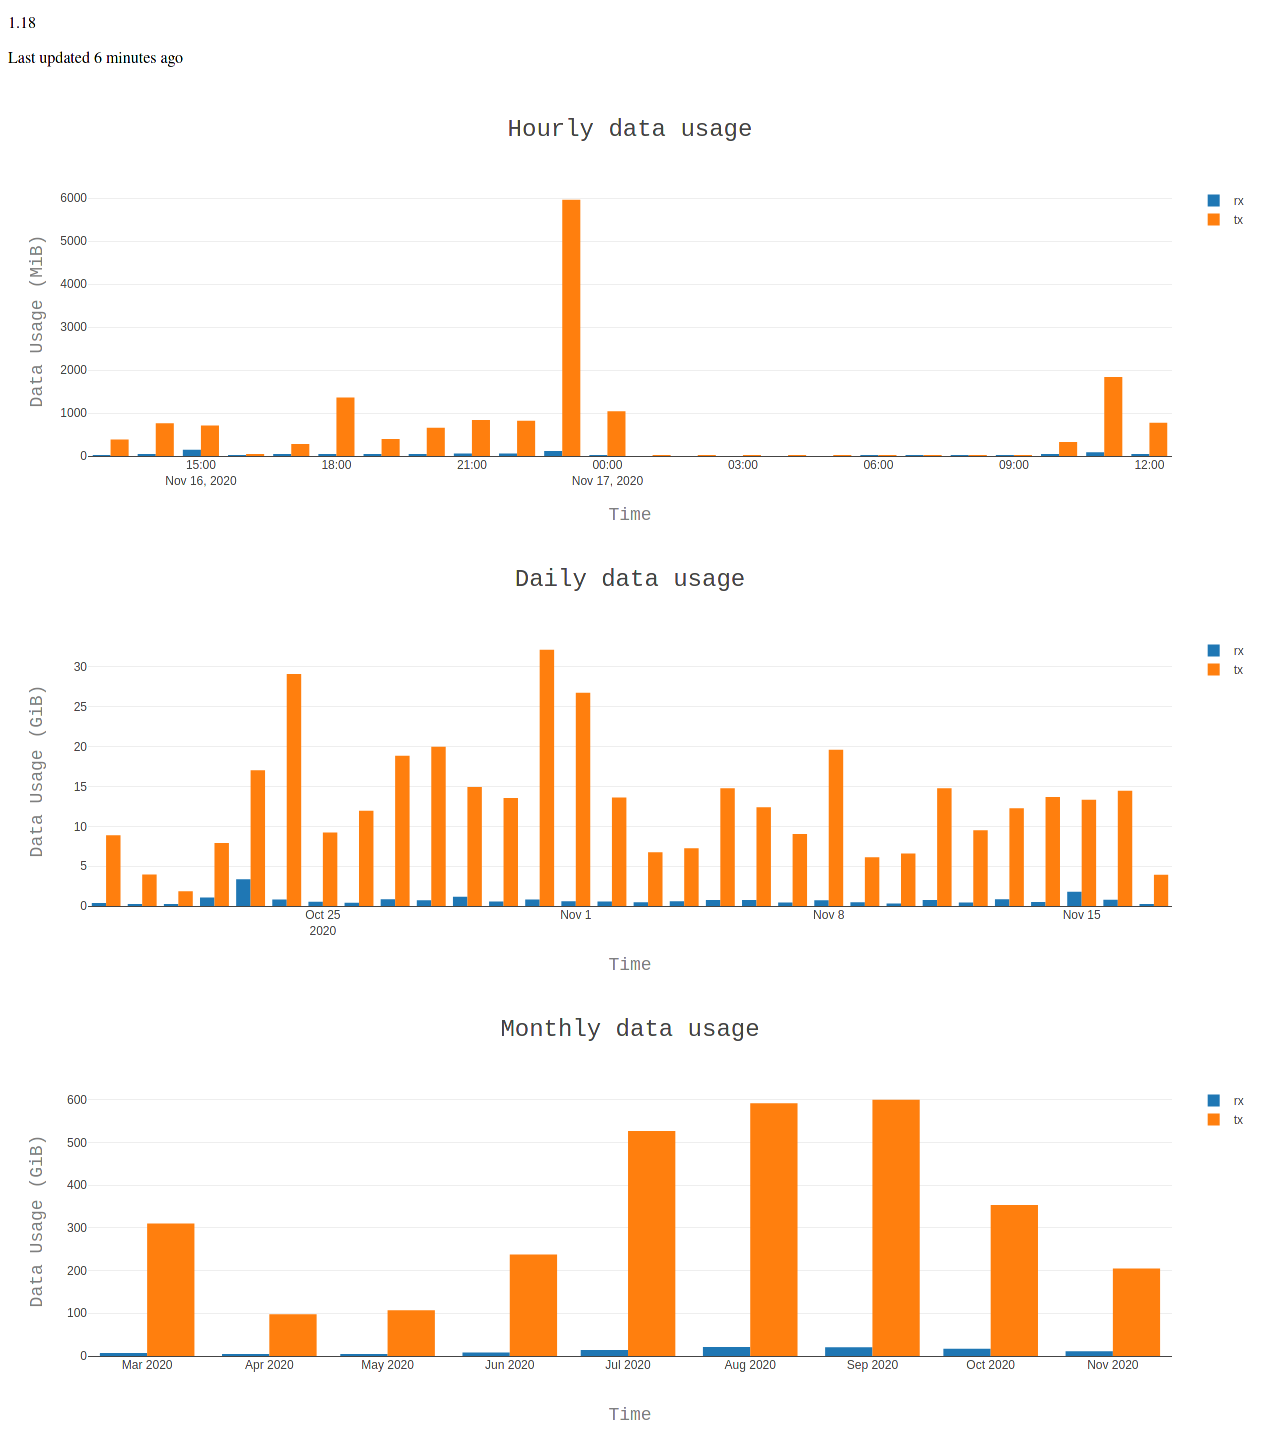
Displays:
- Installed version of vnStat
- The time since the vnStat database was updated
- Multiple Graphs!
- Hourly Graph
- Daily Graph
- Monthly Graph
Why is this a thing when Offical vnstat-dashboard exists?
I wrote this as my machine that runs vnstat is a raspberry pi and I had a bit of trouble getting the docker and docker-compose to install/compile/run on the pi. Also I have pihole installed on the machine did not want to interfere with that web page.
Prerequisites
- Python 3
- vnstat
For the latest version of vnstat or install from your package manager
For Debian/Ubuntu:
sudo apt-get install vnstat
For Arch:
sudo pacman -S vnstat
And (if you want vnstat to log data usage in the background) start the vnstat logging daemon with:
vnstatd -d
How to run
- Clone repo
git clone https://github.com/microhacker07/vnstat-dashboard.git
Or download the zip and extract it
- Move into the directory
cd path/to/vnstat-dashboard
- (Optional) If you want to run it in an virtual environment. To create a virtual environment:
python3 -m venv venv
This helps keeps your packages isolated from other projects. For more information here is the Python Doc
3.1. Activate the virtual environment
. venv/bin/activate
- Install the required Python packages
pip3 install -r requirements.txt
- Run main.py
python3 main.py
Configuring
By editing the main.py you can change:
- The host ip that the server is binded to.
0.0.0.0binds to all interfaces - Default port. Currently is
8080as I was testing it on a pi that already had a different webservice running on port80 - Turn reloader on. This will make it so the bottle server restarts when changes are made to the python code.