orclapex-kpi-gauge
A KPI gauge region plug-in for Oracle APEX.
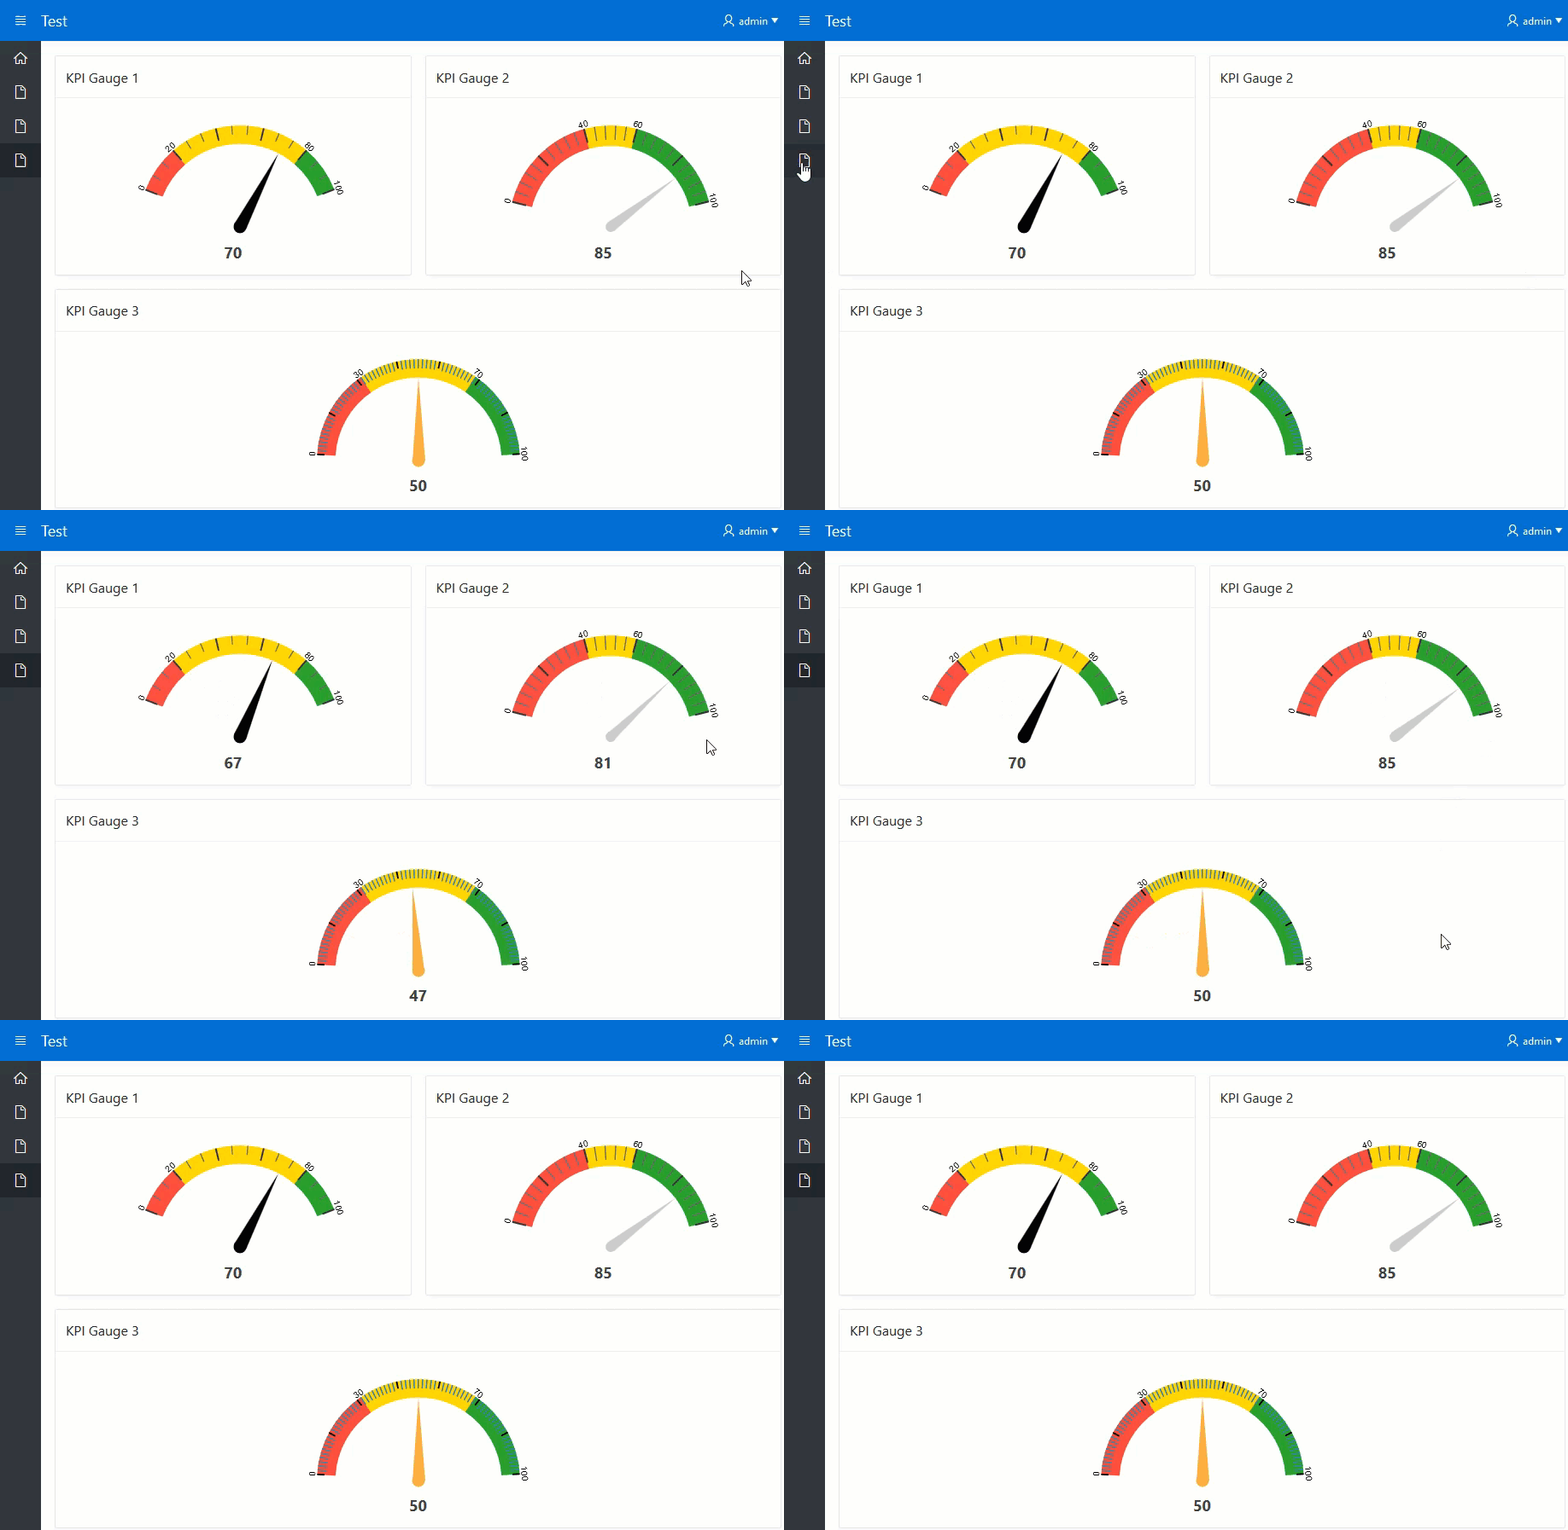
KPI gauges are displayed that indicate the current KPI status. Colors are used that indicate the severity status for each KPI. The interpretation of these colors is what you should expect. Green indicates an acceptable status, yellow indicate a warning status, and red indicates a severe status.
This plug-in is inspired by a blogpost of Bernard Kobos http://bernii.github.io/gauge.js/

Demo
https://apex.oracle.com/pls/apex/f?p=15676:8
How to install
1- Download this repository and import the plug-in into your application from this location:
plugin/region_type_plugin_ir_apex_kpi_gauge.sql
How to use
Create a region of type APEX KPI GAUGE and place your query in its source

Your query must have these values in order: gaugePoint,startPoint,endPoint,startYellow,startGreen
For example in the above query:
gauge point is 70
start gauge is 0
end gauge is 100
start yellow color of gauge is 20
and start green color of gauge is 80
This region have some attributes that the image below shows all of them

Gauge Name: If you have more than one gauge in your page, set different names.
Ticks Divisions: This is the number of major divisions around your arc.
Ticks DivWidth: This is to set the width of the indicator.
Ticks DivLength: This is a fractional percentage of the height of your arc line (0.5 = 50%).
Ticks DivColor: This sets the color of the division markers.
Ticks SubDivisions: This sets the minor tick marks count between major ticks.
Ticks SubLength: This is a fractional percentage of the height of your arc line (0.5 = 50%).
Ticks SubWidth: This is to set the width of the indicator.
Ticks SubColor: This sets the color of the subdivision markers
References
https://github.com/bernii/gauge.js
http://bernii.github.io/gauge.js/
https://www.ibm.com/support/knowledgecenter/en/SSRH46_3.0.0/fxhmondashpgkpigauge.html