![]()
MSMExplorer-d3
A d3.js and WebGL based webapp powered by tornado that creates neat interactive visualizations of MSM data.
Before You Begin
Before running MSMExplorer-d3 locally for development, you should install numpy,scipy,mongodb, pymongo, tornado, heroku-toolbelt,newrelic, networkx, and their respective requirements.
If you simply want to use the webapp for visualization purposes, here is the latest version of MSMExplorer-d3 running on Heroku.
Starting up MSMExplorer-d3 on localhost
Just enter the following into your terminal (while in the msmexplorer-d3 directory):
$> mongod &
$> python app.py
Now you can fire up your favorite javascript-enabled browser and go to localhost:5000 to see the app in action.
Use for Analysis
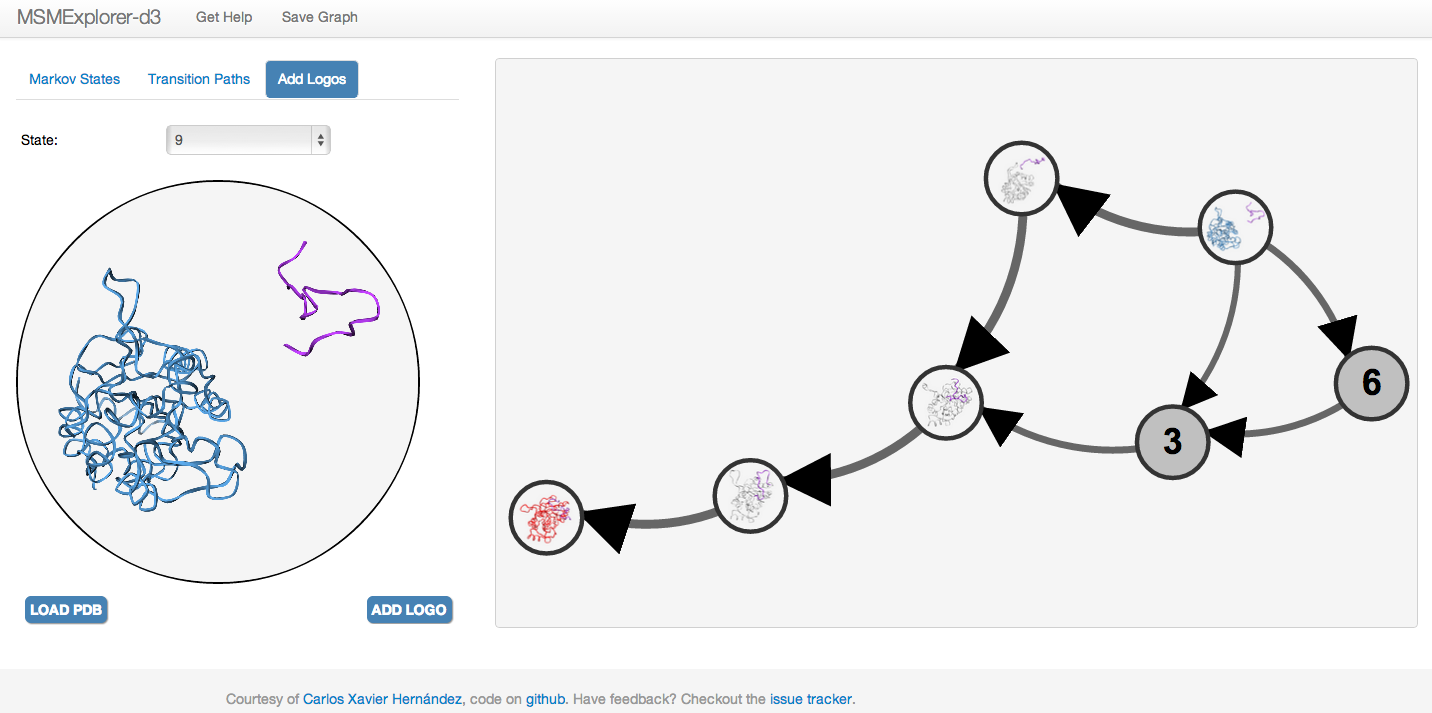
Once you've built your MSM, you can just drag and drop a Matrix Market file (mtx) into the webapp, and start visualizing the graph immediately. You can choose different network metrics with which to resize nodes, zoom, and pan over the graph. You can also go to the Transition Paths tab to generate the N most-likely paths from source states to sink states. You can also upload and visualize PDB files, save a molecule logo to represent a node on the graph, and then finally save the graph as a PNG.
Todo
In the future, we hope to provide additional functionalities:
- Alternative molecular logo representations
- Upload a metric to stratify the pathways for more meaningful analysis.
- Save results to a JSON file.
Please let us know if you'd like to see anything else!
Shoutouts
Inspired by brycecr/msmexplorer, powered by: