fk-esr-info
Florida Keys infographic update using Ecosystem Status Report website
Working infographic (without styling): https://noaa-iea.github.io/fk-esr-info/infographic_r.html
Goal
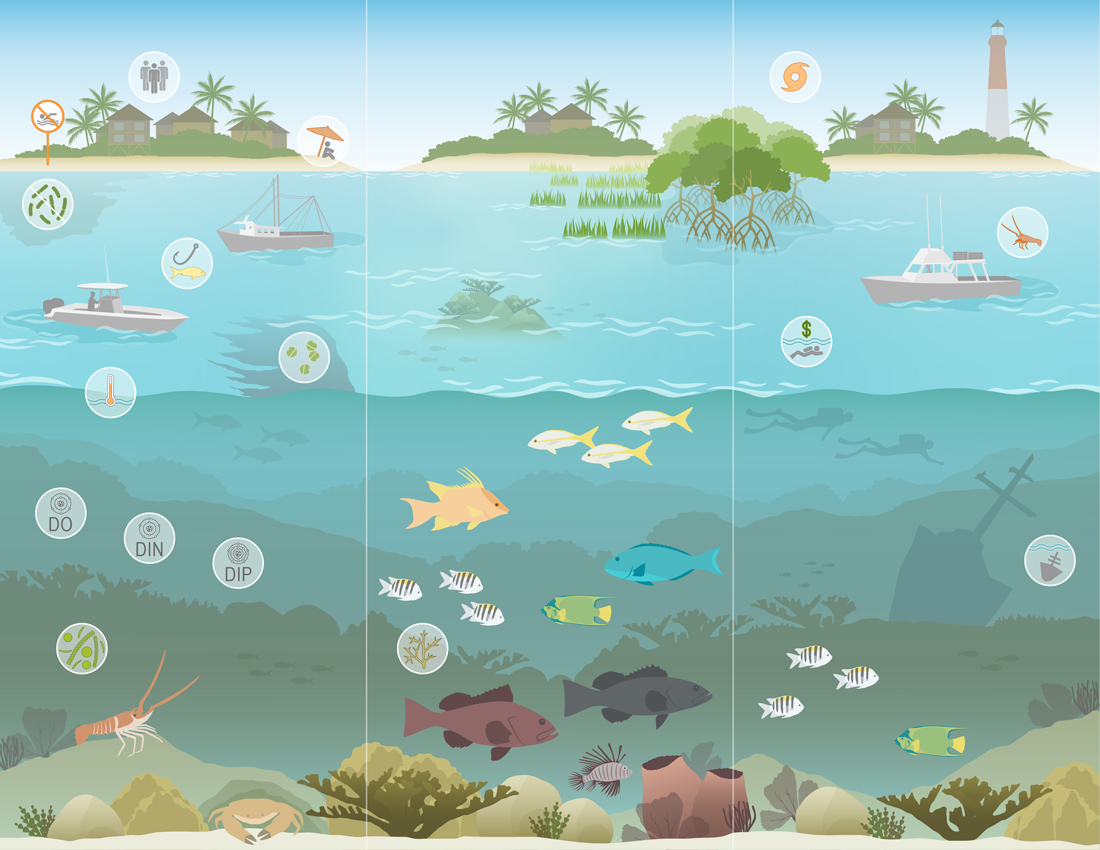
Create a navigational page using provided art clickable by element to popup-windows (i.e. "modals") display time series data plotted individually.
Develop
Because of CORS dependencies, need to view in local webserver, for instance:
servr::httd()Rendering
source("_make_infographic_modals.R")Materials
- website
- infographics
- info-demo contains JavaScript (JS) and styling (CSS) for linking art (*.svg) to a seperate web page with data plotted
- data
- fknms_esr_indicator_data folder containing comma-seperated value (*.csv) data files per indicator
- convert csv data to modal windows containing time series plots with highcharter using R
- art
- FKIEA Icons - Google Drive: Adobe Illustrator (*.ai) and scalable vector graphics (*.svg) versions of art scene and elements
- Key matching indicators to icon file names - Google Docs
