Linear Regression using Gradient Descent
What it does...
This was just a fun experiment to use Gradient Descent to perform linear regression. Linear regression is all about finding the line of best fit of all given data points.
Usage
python linear_reg.pyTo run the linear regression program
python plot_points.pyTo plot the points and the "Line of best fit".
python reg_lorentzian_peak.pyTo run the linear regression program with the lorentzian peak function
Dependecies
    pip install numpy
    pip install scipy
    pip install matplotlib
Output
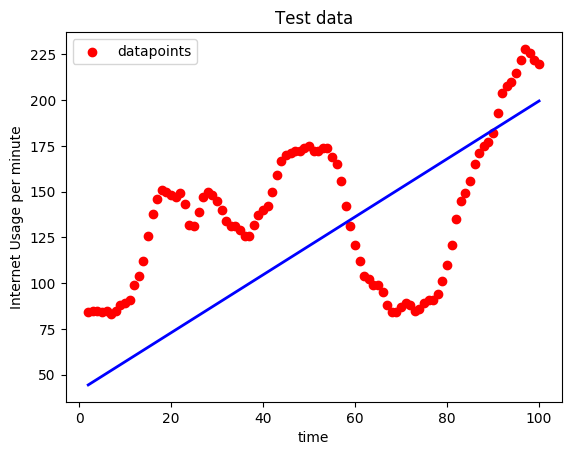
This is the plot of the 'Line of Best Fit' and the data points.Since the data points are so scattered The line really doesn't help get a really good prediction.
- The data points are that of internet usage per minute
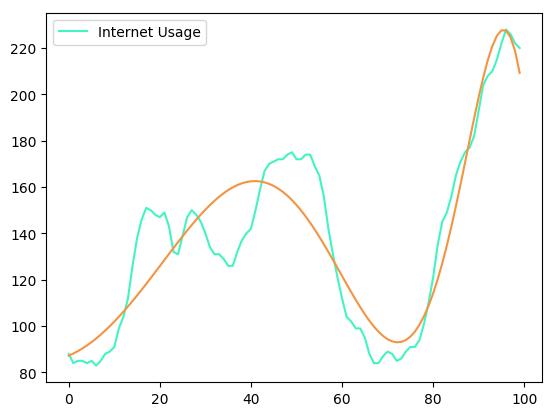
Using the Double Lorentzian peak equation with a genetic algorithm
We observe that this straight line doesn't really tells us much about the trend in the data. So in order to fit the data better, instead to fitting a line we will now fit a curve.
We will also add a gradient descent optimizer that is built into scipy to optimise the code even more. This optimizer helps us choose "good" initial points that will speed up the gradient descent process. It will also will prevent getting stuck in a local minima.This becomes crucial when we have a more complex error space.
We can also see that the results are clearly much better
Footnote
The author has also included another dataset for you to try out that shows CO2 concentration in the atmosphere.
- Check this out for more datasets