python-criticalpath
This is a tool to find the critical path in the build process of Yocto artifacts. It uses the information provided by the task dependency graph and a build's "buildstats".
Prerequisites
In order to find the critical path in the build process accurately you need to
run one build with all the targets that you are interested in, e.g. use a clean
build to also consider fetching, or use a build without sstate to consider even
cached steps. In this build you need to enable "buildstats", for example adding
the following to your local.conf:
INHERIT += "buildstats"After the build, make note of your buildstats directory, e.g.
build/tmp/buildstats/<timestamp>.
Then, to generate the dependency graph use bitbake:
bitbake -g <your-image>This should generate build/task-depends.dot.
Usage
Given that you have the dependency graph and the buildstats directory you can find the critical path of the build using:
python -m criticalpath <path/to/task-depends.dot> <path/to/buildstats-dir> ...It is possible to specify multiple buildstats directories, so that you can reasonably combine, for example, a fetchall and an actual build in the same critical path analysis, for example:
python -m criticalpath build/task-depends.dot build/tmp/buildstats/*Note that if you have multiple python versions installed on your system, you
might need to use python3:
python3 -m criticalpath ...Visualizing the results
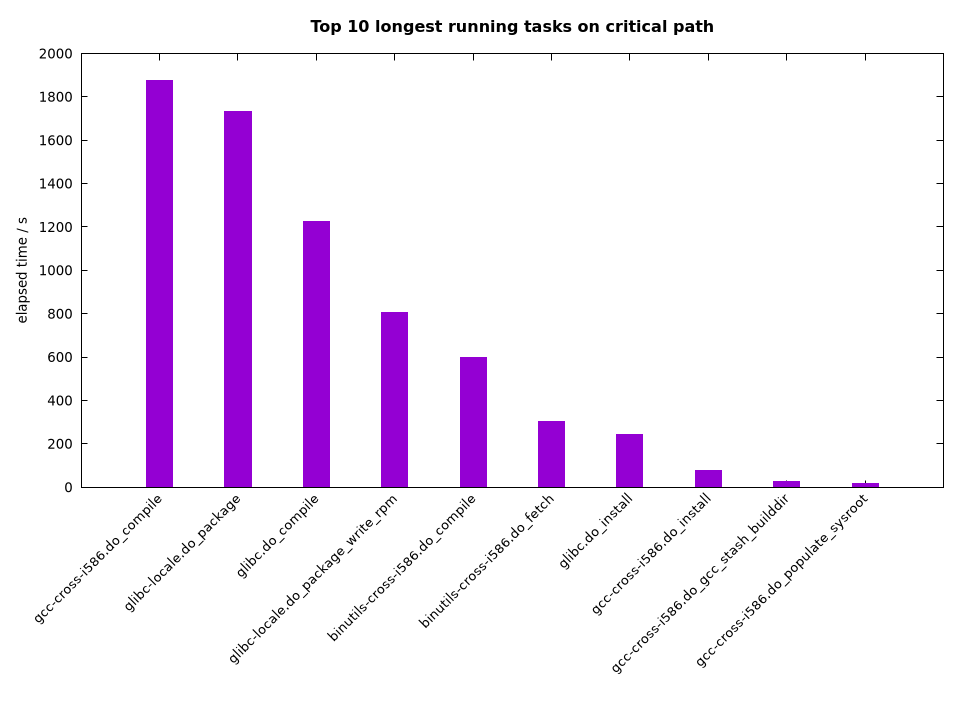
The tool produces one line for each package step including the step name and the elapsed time in seconds, e.g.:
...
glibc.do_compile 1223.24
glibc.do_configure 7.93
glibc.do_prepare_recipe_sysroot 0.3
libgcc-initial.do_populate_sysroot 0.73
libgcc-initial.do_extra_symlinks 0.02
...
You can use your favorite plotting program to show the top 10 longest running
tasks on the critical path, for example using the tools sort, head, and
gnuplot:
python -m criticalpath ... \
  | sort -nrk 2 | head -n 10 > top10.dat

gnuplot <<EOF
set terminal pngcairo size 960,720 noenhanced font 'Verdana,10'
set output 'top10.png'

set rmargin 2
set style fill solid
set style data histograms
set xtic rotate by 45 right
set ylabel 'elapsed time / s'
set title 'Top 10 longest running tasks on critical path' font 'Verdana-Bold,12'
unset key
plot 'top10.dat' using 2:xtic(1)
EOF
Dependencies
In order to run the tool you only need python >= 3.5.
Run the tests
A Makefile is provided that will run the unit tests as well as the flake8
linter which has to be installed:
make test