BIO 453: Quantitative Methods Semester Project
This project is an analysis of shot location data from the National Basketball Association.
shotDataScraper.R
This R script file contains three functions and some other code to gather data from NBA.com
Gathering the player ID and team ID data
Using the fromJSON function from the rjson package we can download and read in the data from the NBA's website. This data then has to be unlisted and converted to a dataframe object. This ID data is used to lookup players by name in the functions from this project. The ID dataframe is also subsetted by unique teams to create a dataframe of the teams in the NBA. This code is required for all subsequent functions in this repository.
getShotData(playerName)
This function accepts a player's name as a string in the form "FirstName LastName" and returns a dataframe of shot data for that player from the 2015-16 season. The resulting dataframe includes 21 variables that categorize the location, the context, and result of each shot. Each observation in the dataframe represents a shot taken by that player. This function is required for all shot chart functions in this repository
Example
## fetch shot data for Klay Thompson
klay <- getShotData("Klay Thompson")
getRoster(teamAbbr)
This function accepts a team's three character abbreviation as a string and returns a vector of each player ("FirstName LastName") on that team.
Example
# fetch roster for the Golden State Warriors
gswRoster <- getRoster("GSW")
getTeamShooting(team)
This function accepts a team's three character abbreviation as a string and returns a dataframe of shot data for each player on that team. The function loops through the roster of the team and aggregates the shot data of each player on the roster.
Example
# fetch team shooting data for the Golden State Warriors
gswShooting <- getTeamShooting("GSW")
getCentroids(player)
This function finds the mean locations of a players shot attempts and makes in six zones of the scoring area.
shotCharts.R
MUST HAVE getShotData FUNCTION LOADED FOR THESE FUNCTIONS TO OPERATE PROPERLY
This R script file contains functions to gather and plot shooting data for a player.
basicShotChart(player)
This function accepts a player's name as a string in the form of "FirstName LastName" and returns a plot of the xy coordinates from the player's shot data. The points are color coded by result where a blue point represents a missed shot and red represents a made shot.
Example
# plot shot chart of Klay Thompson
klayBasic <- basicShotChart("Klay Thompson")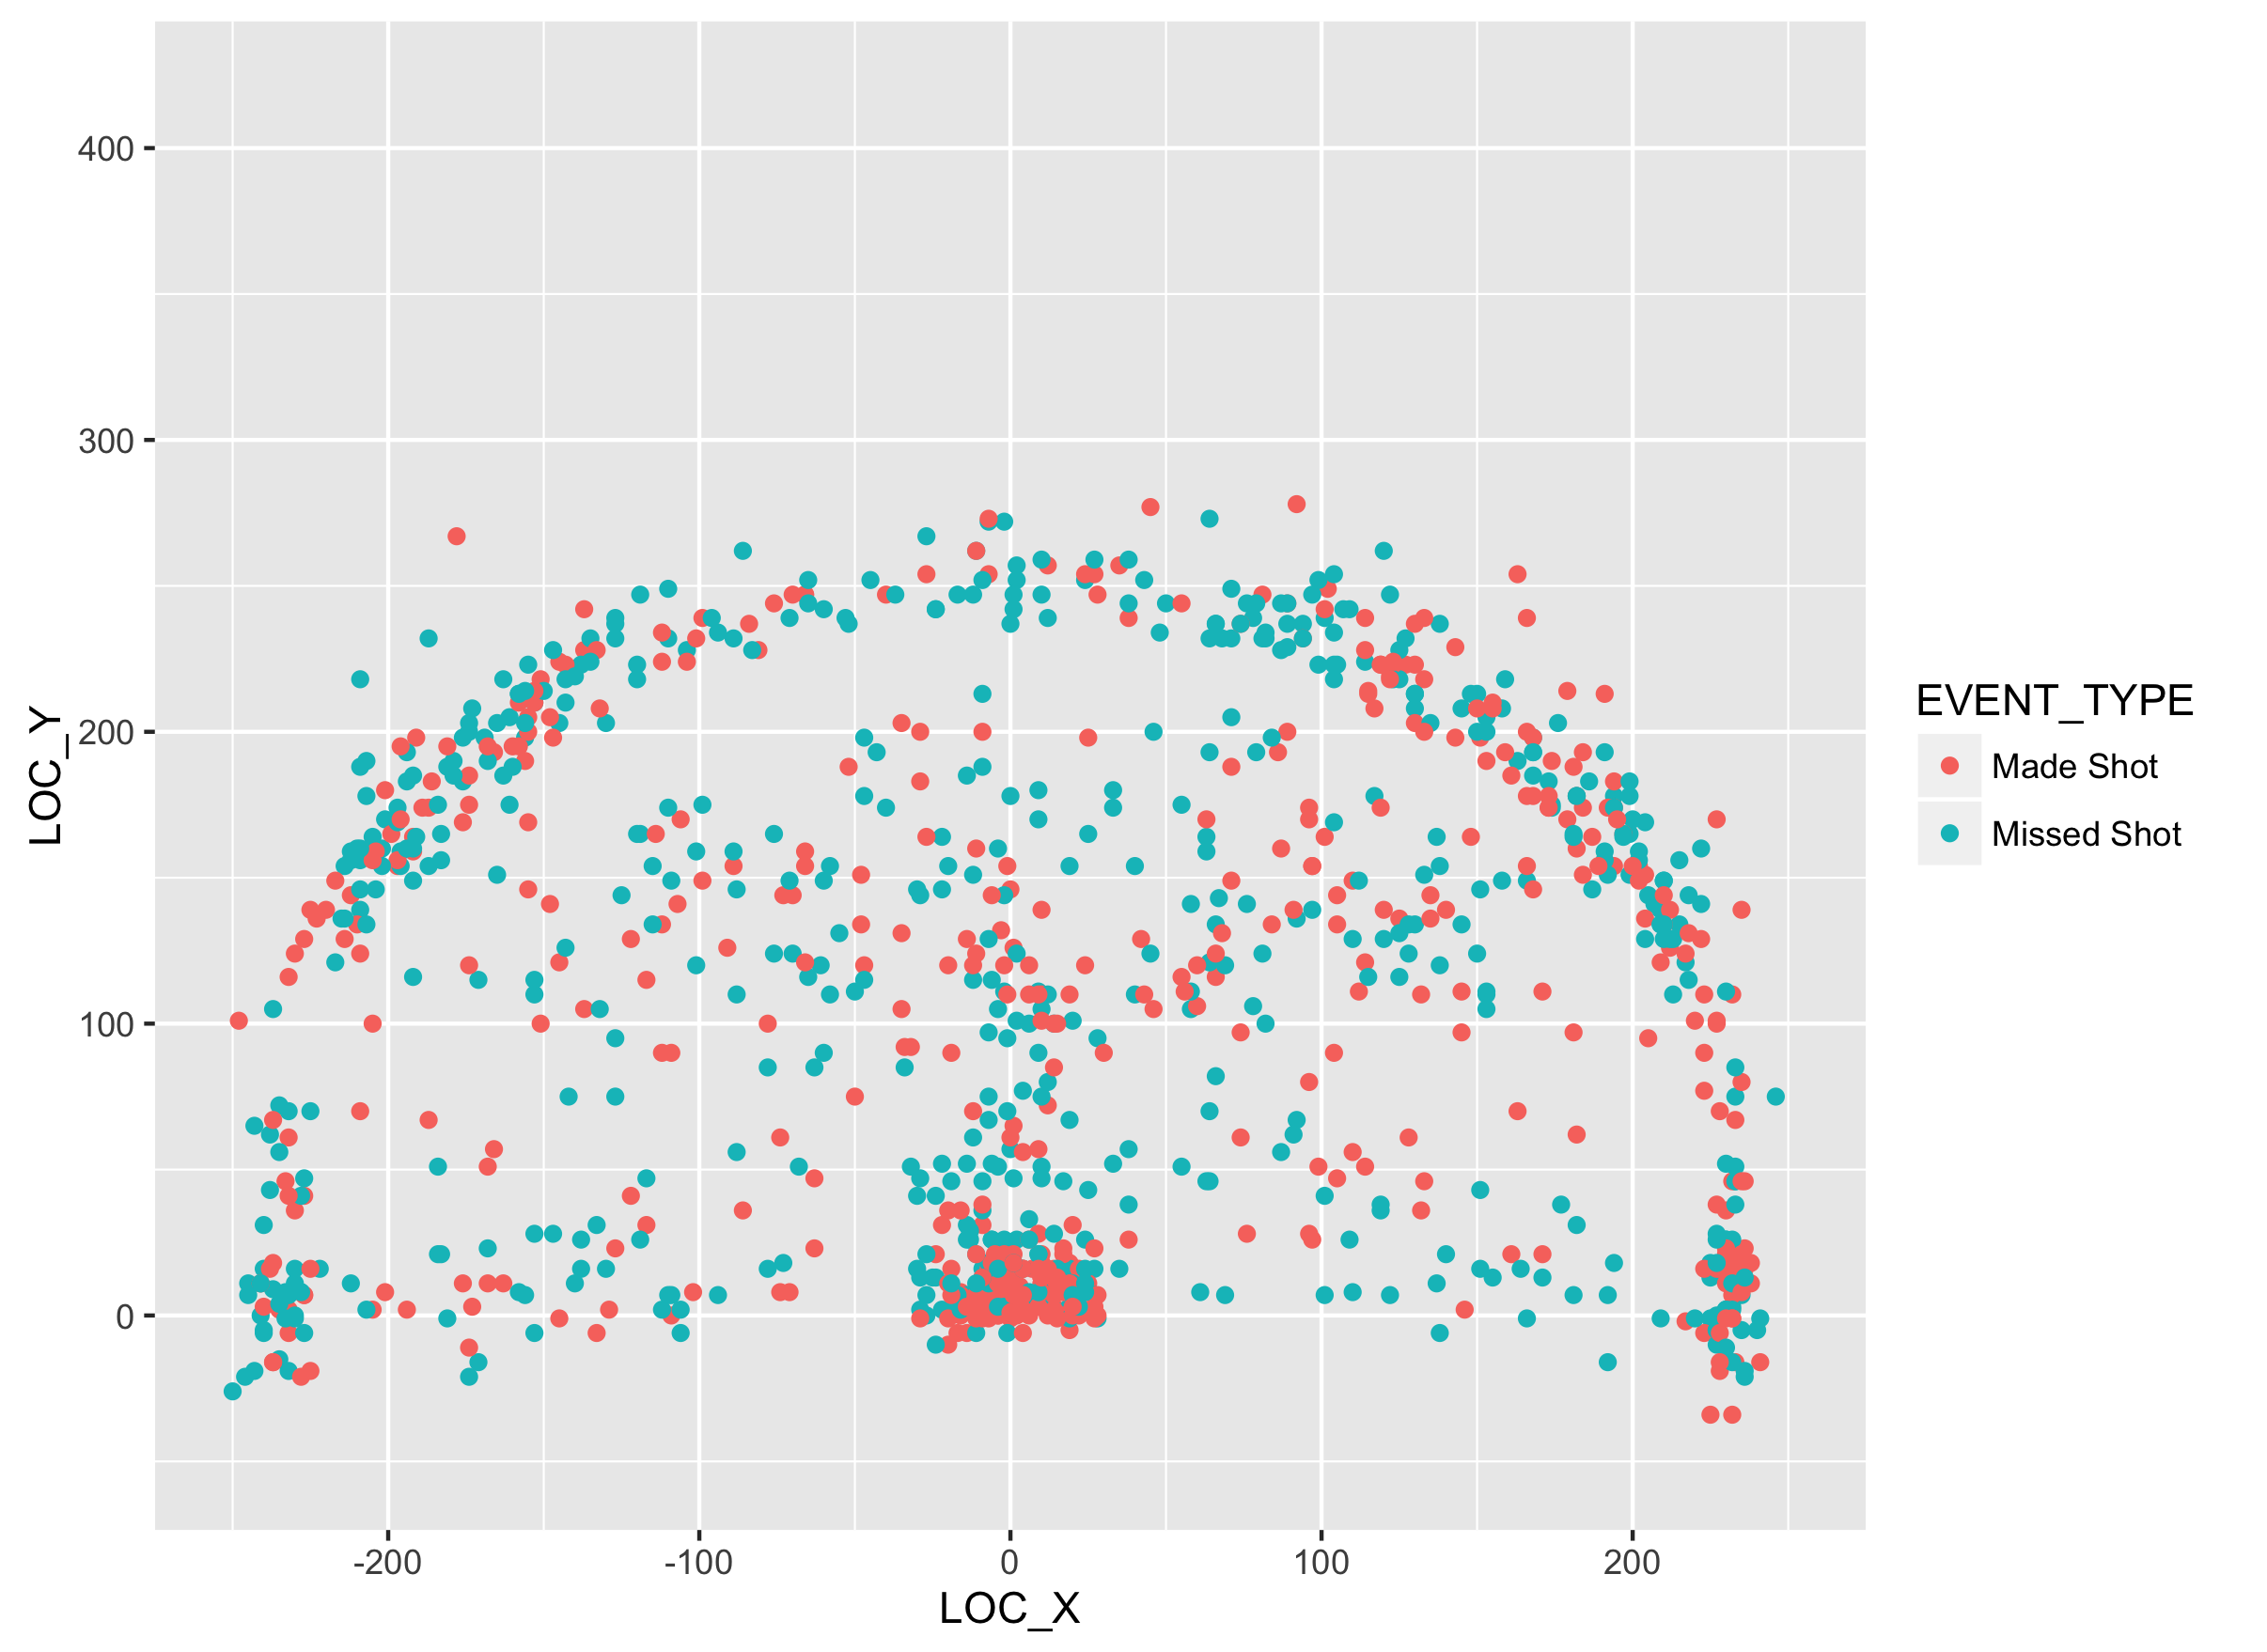
shotModelFit(player)
This function accepts a player's name as a sting in the form of "FirstName LastName" and applies a binomial regression to model shot success by x coordinate and y coordinate. The returned product is a dataframe of xy values and the predicted outcome of a shot taken at the location. This function is required for densityShotChart()
Example
# model shot success of Stephen Curry
steph <- shotModelFit("Stephen Curry")
densityShotChart(player)
This function accepts a player's name as a string in the form of "FirstName LastName" and returns a plot of expected outcomes from shots taken at specific locations. The plot also includes contour zones that show the density of shots by xy location. The points for the shots are color coded on a scale of yellow to red with yellow being low probability of making a shot and red being high probability. The density contours are color coded with light blue being more heavily concentrated and dark blue is less concentrated areas.
Example
# plot shot chart of Klay Thompson with density contours
densityShotChart("Klay Thompson")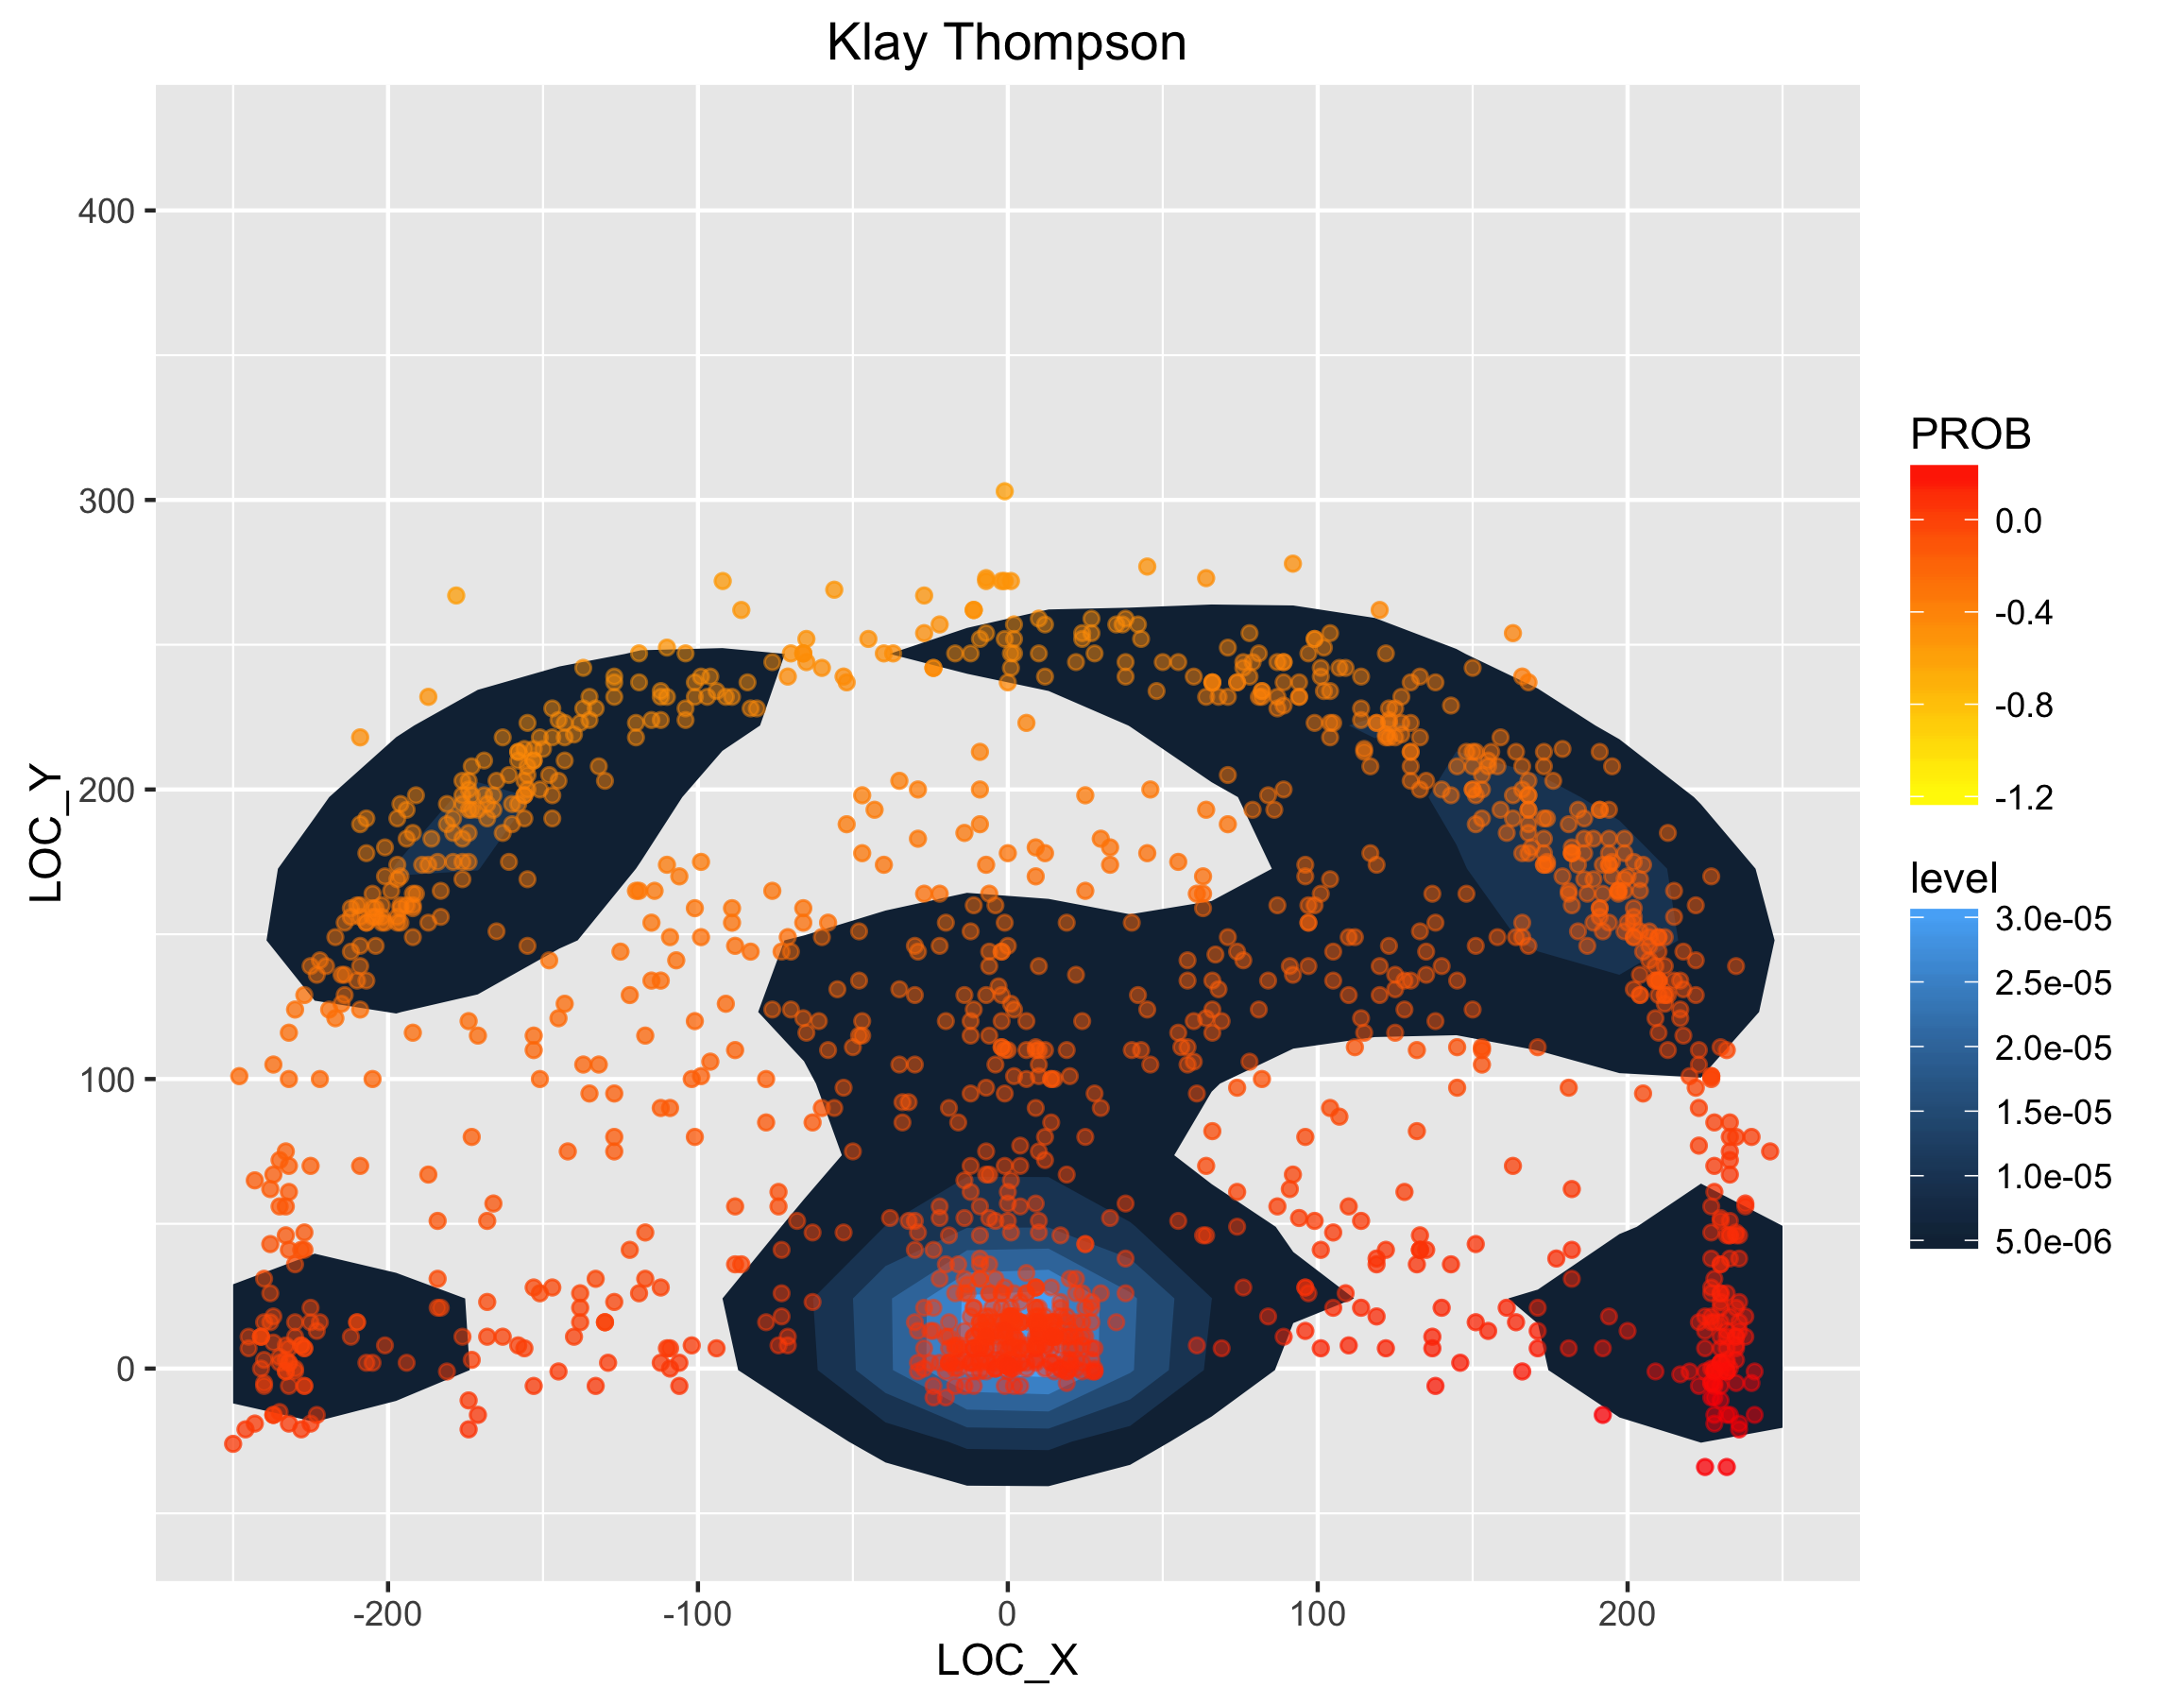
centroidChart(player)
This chart is still being developed
This function accepts a player's name as a string in the form of "FirstName LastName" and returns the density shot chart with added centroid points. The green points represents the player's centroids of shot attempts. The pink points represents the player's centroids of made shots.
Example
#plot DWyane Wade's shot chart with centroid points
centroidChart("Dwyane Wade")
playTypeScraper.R
This R script file contains a function to scrape play type data from NBA.com
getPlayData(TmPlyr, PlayType, offDef)
This function scrapes play type data from NBA.com. It requires three inputs from the user. The user must first specify "team" or "player". "team" will return the statitics for each NBA team as a whole while "player" returns statistics for each player in the league. Then the user must specify the type of play. There are ten possible inputs for this variable: "Transition", "Isolation", "PRBallHandler", "PRRollMan", "Postup", "Spotup", "Handoff", "Cut", "OffScreen", and "OffRebound". Finally the user chooses whether they wish to gather either "Offense" or "Defense" statistics.
Example
#fetch offensive statistics for pick and rolls for the ball handler aggregated at the player level
getPlayData("player", "PRBallHandler", "Offense")