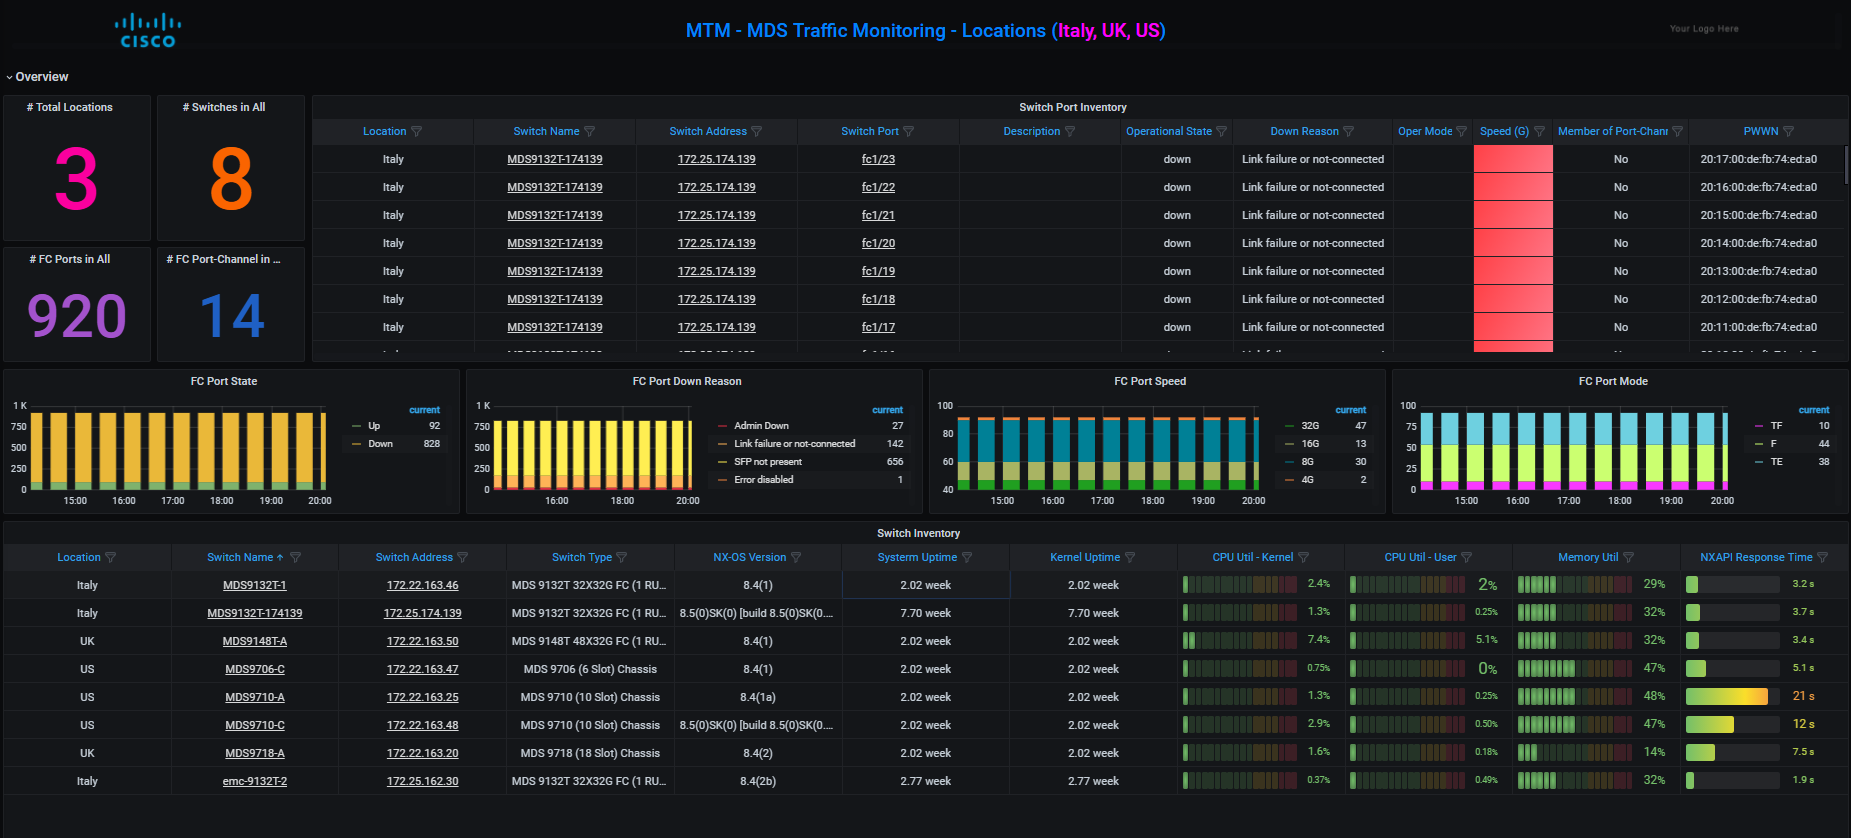
Cisco MDS Traffic Monitoring (MTM)
Cisco MDS 9000 monitoring using Grafana and InfluxDB
Global Inventory

Digital Optical Monitoring of SFP (Hottest, Coldest, Lowest RX and TX Power)

Digital Optical Monitoring of SFP

Top-10 ports (Traffic, Congestion, Errors, etc.)

Switchport monitoring

Port-Channel traffic distribution

and much more...
Architecture
The MTM collector (mds_trafficmonitor*.py) pulls stats from Cisco MDS switches using NX-API. The stats are normalized and corrected before writing to InfluxDB. Finally, Grafana provides the visualization and use-cases.
- Data source: Cisco MDS Switches via NXAPI), read-only account is enough
- Data storage: InfluxDB, a time-series database
- Visualization: Grafana
Installation
- Tested OS: CentOS 7.x. Should work on other OS also.
- Python version: Version 3 only. Should be able to work on Python 2 also with minor modification.
DIY Installation
- Install Telegraf
- Install InfluxDB
- Install Grafana
- Download this repo in zip format or via git clone.
Configuration
Enable NX-API on MDS swithces via feature nxapi command.
Enter the access details of the MDS switch in mds_group*.txt file. Refer to the file for more details on input format.
Try
$ python3 /usr/local/telegraf/mds_traffic_monitor*.py -hAdd to your telegraf.conf file as below
[[inputs.exec]]
   interval = "30s"
   commands = [
       "python3 /usr/local/telegraf/mds_traffic_monitor_high_frequency.py /usr/local/telegraf/mds_group_1.txt influxdb-lp -vv",
   ]
   timeout = "28s"
   data_format = "influx"
Create a different mdsgroup.txt file for every MDS switch. Repeat the above seven lines in telegraf.conf as many times as the number of monitored MDS switches. The name of the mds_group.txt file can be changes to help you remember the switch.
Also update the global values like
  logfile = "/var/log/telegraf/telegraf.log"
  logfile_rotation_max_size = "10MB"
  logfile_rotation_max_archives = 5
Import the Grafana dashboard json files. That is all. Enjoy!
I haven't written detailed installation instructions yet. Nor do I have an OVA. If you are new to Grafana, InfluxDB and Telegraf, follow the steps from the UTM installation - Cisco UCS monitoring using Grafana, InfluxDB, Telegraf – UTM Installation. The MTM project follows the same design as the UTM project. Most of the steps are the same. Make sure to replace ucs_traffic_monitor.py by mds_trafficmonitor*.py and ucs_domains_group_1.txt by mds_group_1.txt.