![]()
PKScreener
 |
 |
 |
||
|---|---|---|---|---|
| Platforms |  |
|||
| Package / Docs |  |
 |
 |
|
| Tests |
What is PKScreener?
| Telegram Alerts | Nifty AI Prediction | Scheduling Cron Jobs | On-Demand Telegram Bot | Backtesting / Growth of 10k | |
|---|---|---|---|---|---|
| Nifty screening | Volume scanners | Breakout detection | Consolidating stocks | Reversal Signals | |
| Chart Patterns | CCI scanners | 2% scanners | Short-term bulls | NR4 / NR7 | Daily Releases |
| Fair Value | Mutual funds, FII data | TTM Squeeze | Golden Crossover | Death Crossover | |
| RSI screening | MACD scanners | IPO Stocks | Momentum Gainers | Watchlist screening | |
| Stock Performance | 52Wk-H/L Breakouts | 10 days low breakouts | Aroon Crossover | Next Day Bullish Stocks | |
| Today's Breakouts | Breaking out now | Popular stocks by Mutual Funds / FIIs | Higher Highs | Lower Lows | |
| F&O Stocks screening | Live 5-EMA Index Scan | Logging | Telegram Channel | Early Breakouts | |
| ATR Cross | ATR Trailing Stops | Intraday Bid/Ask Build-up | Quick Backtest | Morning vs Day-close profit analysis | |
| Multiple period/duration support | Daily OHLCV | Intraday OHLCV | Auomated Software Updates | NASDAQ Index Support | |
| Nifty 50 | Nifty Next 50 | Nifty 100 | Nifty 200 | Nifty 500 | |
| Nifty Smallcap 50 | Nifty Smallcap 250 | Nifty Midcap 50 | Nifty Midcap 100 | Nifty Midcap 150 | |
| Nifty All 2000 | Nifty Newly Listed (IPOs in last 2 Year) | Nifty F&O Stocks | View Stock Performance | High Momentum(RSI,MFI,CCI) | |
| Intraday Monitor | Scanner pinning | Stock list Pinning | VCP (Volatility Contraction Pattern) | VCP (Mark Minervini) | |
| Moving Average Signals | Candle-stick Patterns | Trendline Support Stocks | Bullish/Bearish Inside Bar | Volume Spread Analysis | |
| Narrow Range (NRx) Reversal | Lorentzian Classifier | PSAR and RSI reversal | Rising RSI | RSI MA Reversal | |
| Upcoming CA stocks | High Dividend Stocks | Fair Value Buy Opportunities | Shareholding by number of Mutual Funds/FIIs | Bullish for next day |
A Python-based stock screener for NSE, India.
pkscreener is an advanced stock screener to find potential breakout stocks from NSE and tell it's possible breakout values. It also helps to find the stocks which are consolidating and may breakout, or the particular chart patterns that you're looking specifically to make your decisions. pkscreener is totally customizable and it can screen stocks with the settings that you have provided.
| You can get daily scan results/alerts at scheduled times by subscribing to the following Telegram channel: | Purpose | Description/link | QR Code |
|---|---|---|---|
| Alerts Channel | https://t.me/PKScreener > You wil receive all the major alerts on this telegram channel. These alerts are sent for all major strategy scans daily around 9:30am-10:15am and then around 4pm. You will also receive the next day's market predictions. |  |
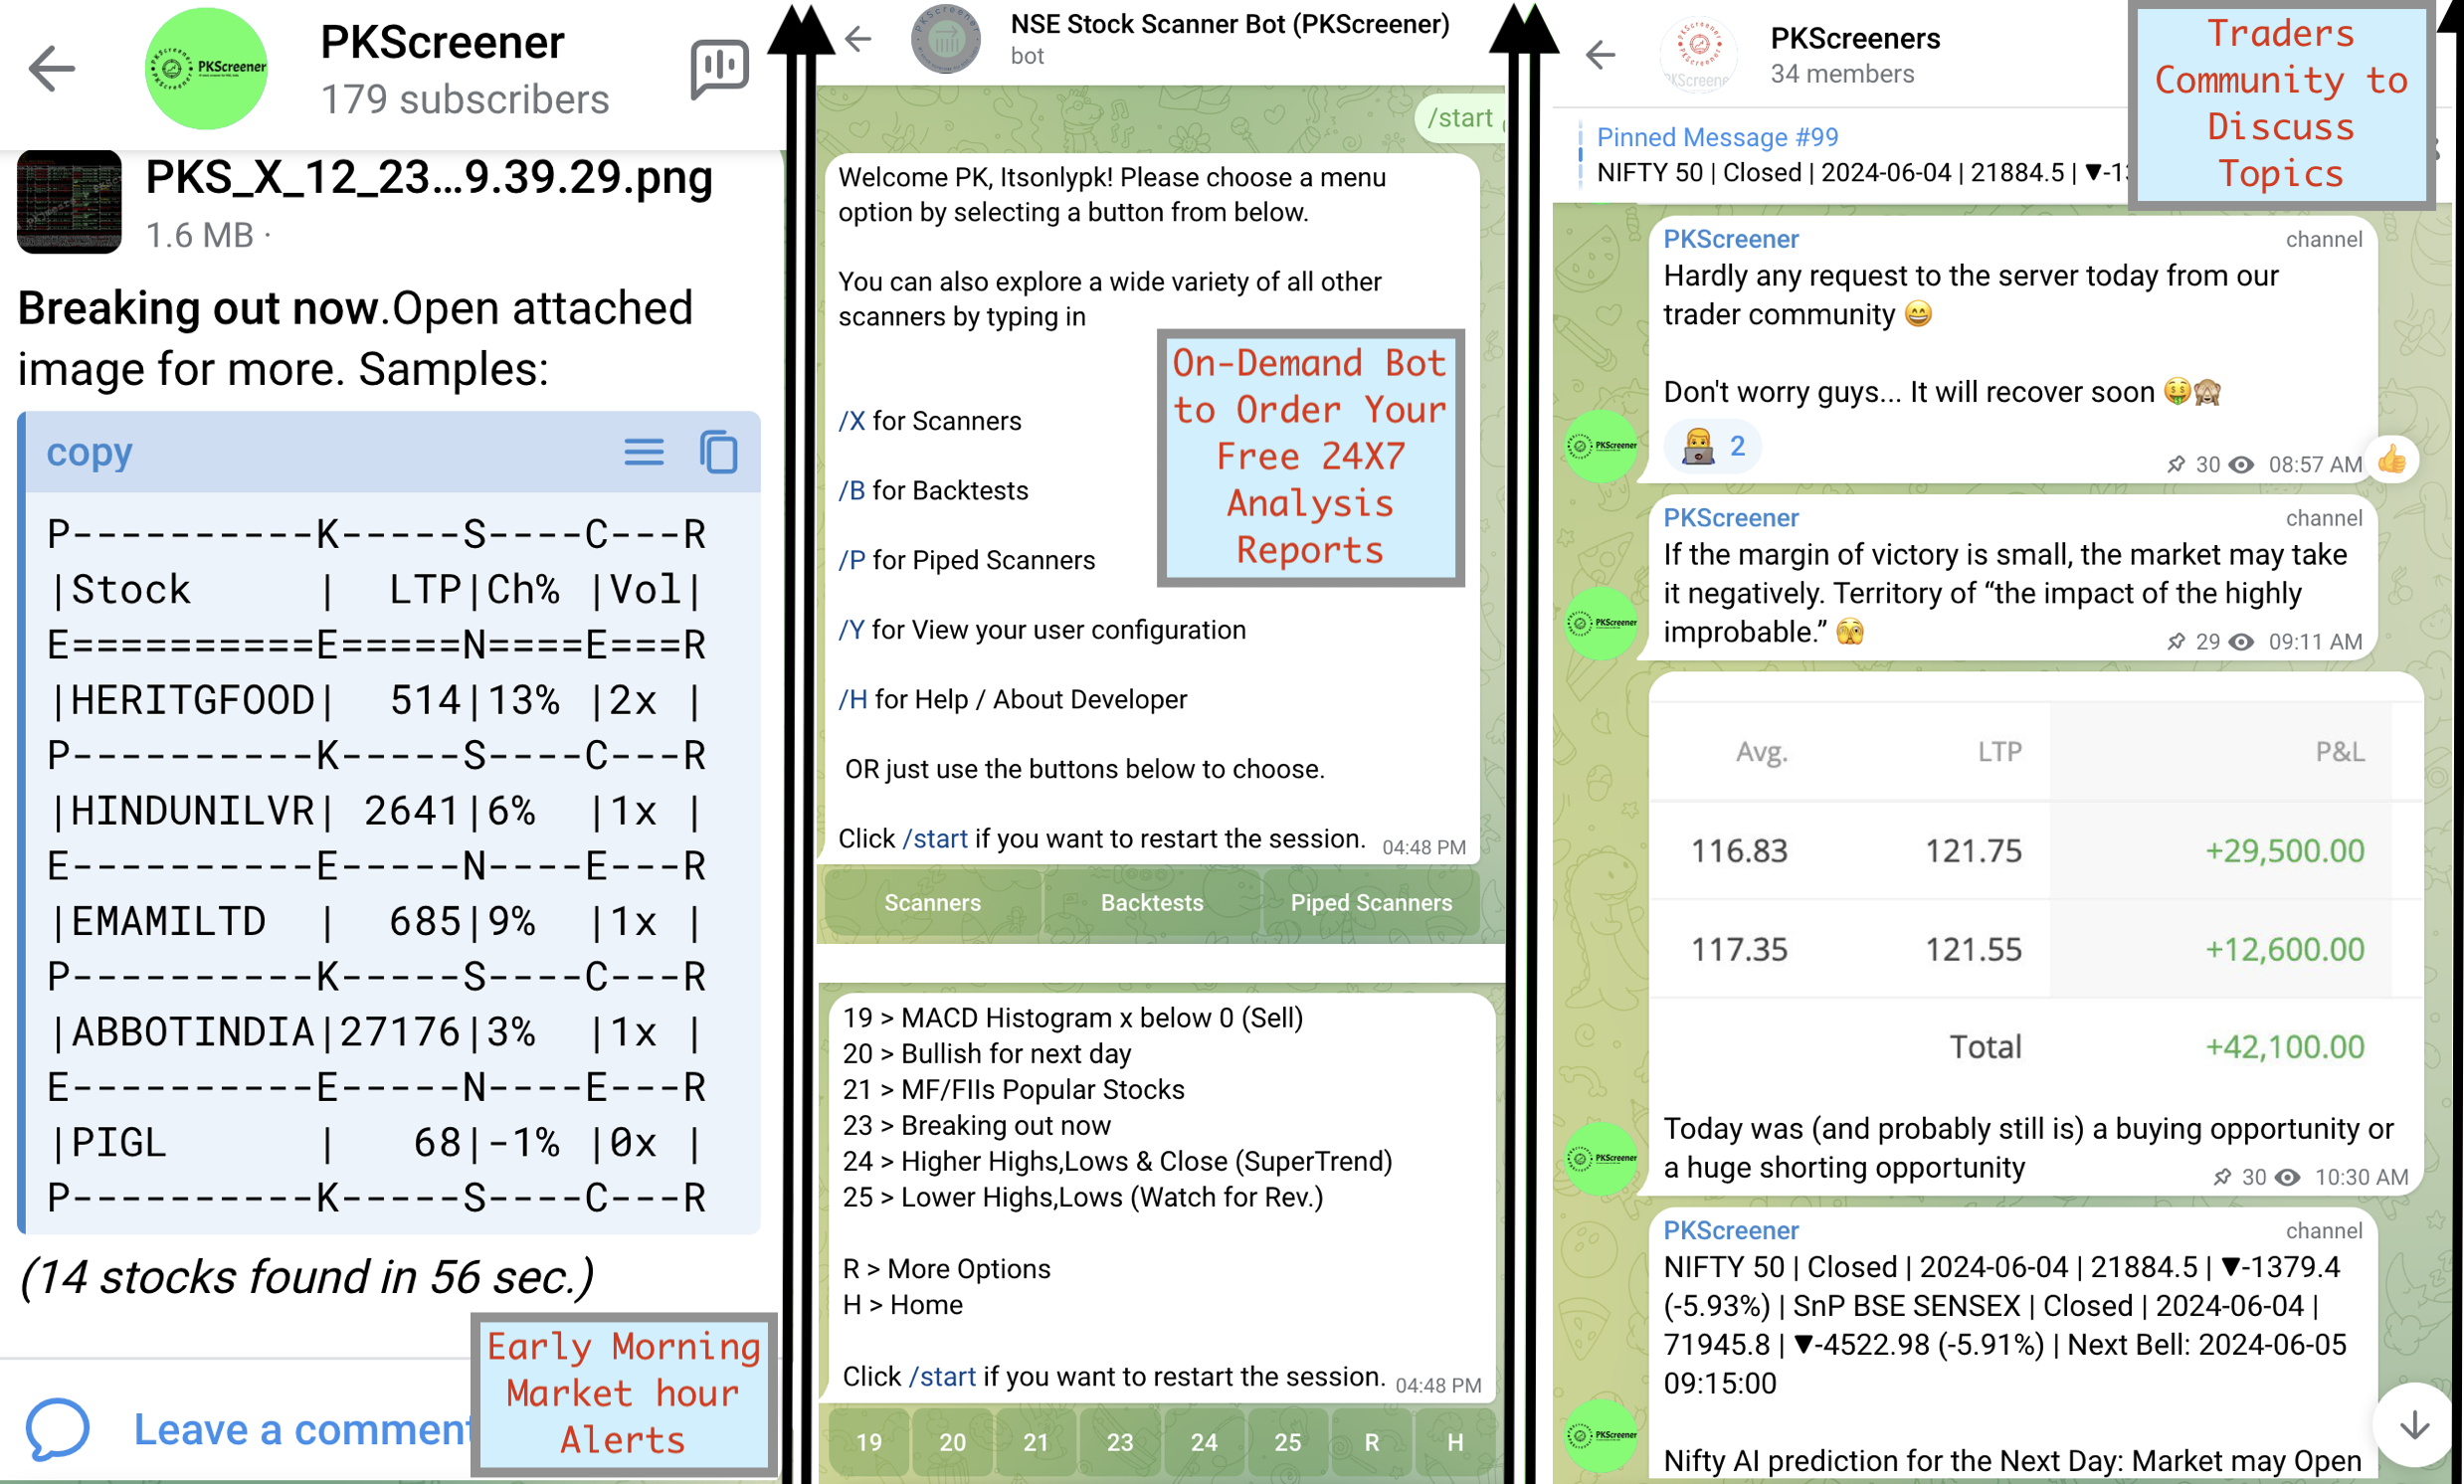
Receiving Scheduled Scan results
If you would like to receive the scan results, please join the telegram channel and group above. You may receive the following scan results:
 by 4pm IST, Monday - Friday
-
For all Nifty stocks at/by 9:45-10:15am and by 4pm IST, Monday - Friday
- Certain selected but configurable alerts for specific scan types
Receiving On-Demand Scan results
You can now run the pkscreenerbot on your local machine or if it's running on the GitHub server under a GitHub Actions workflow, you can use the pkscreener Bot(@nse_pkscreener_bot on Telegram) to get on-demand scan results.
Scanners
Screening options to choose from:
X > Scanners
M > Monitor Intraday
S > Strategies
B > Backtests
G > Growth of 10k
C > Analyse morning vs close outcomes
P > Piped Scanners
T > Toggle between long-term (Default) [Current (1y, 1d)] and Intraday user configuration
D > Download Daily OHLC Data for the Past Year
I > Download Intraday OHLC Data for the Last Trading Day
E > Edit user configuration
Y > View your user configuration
U > Check for software update
L > Collect Logs for Debugging
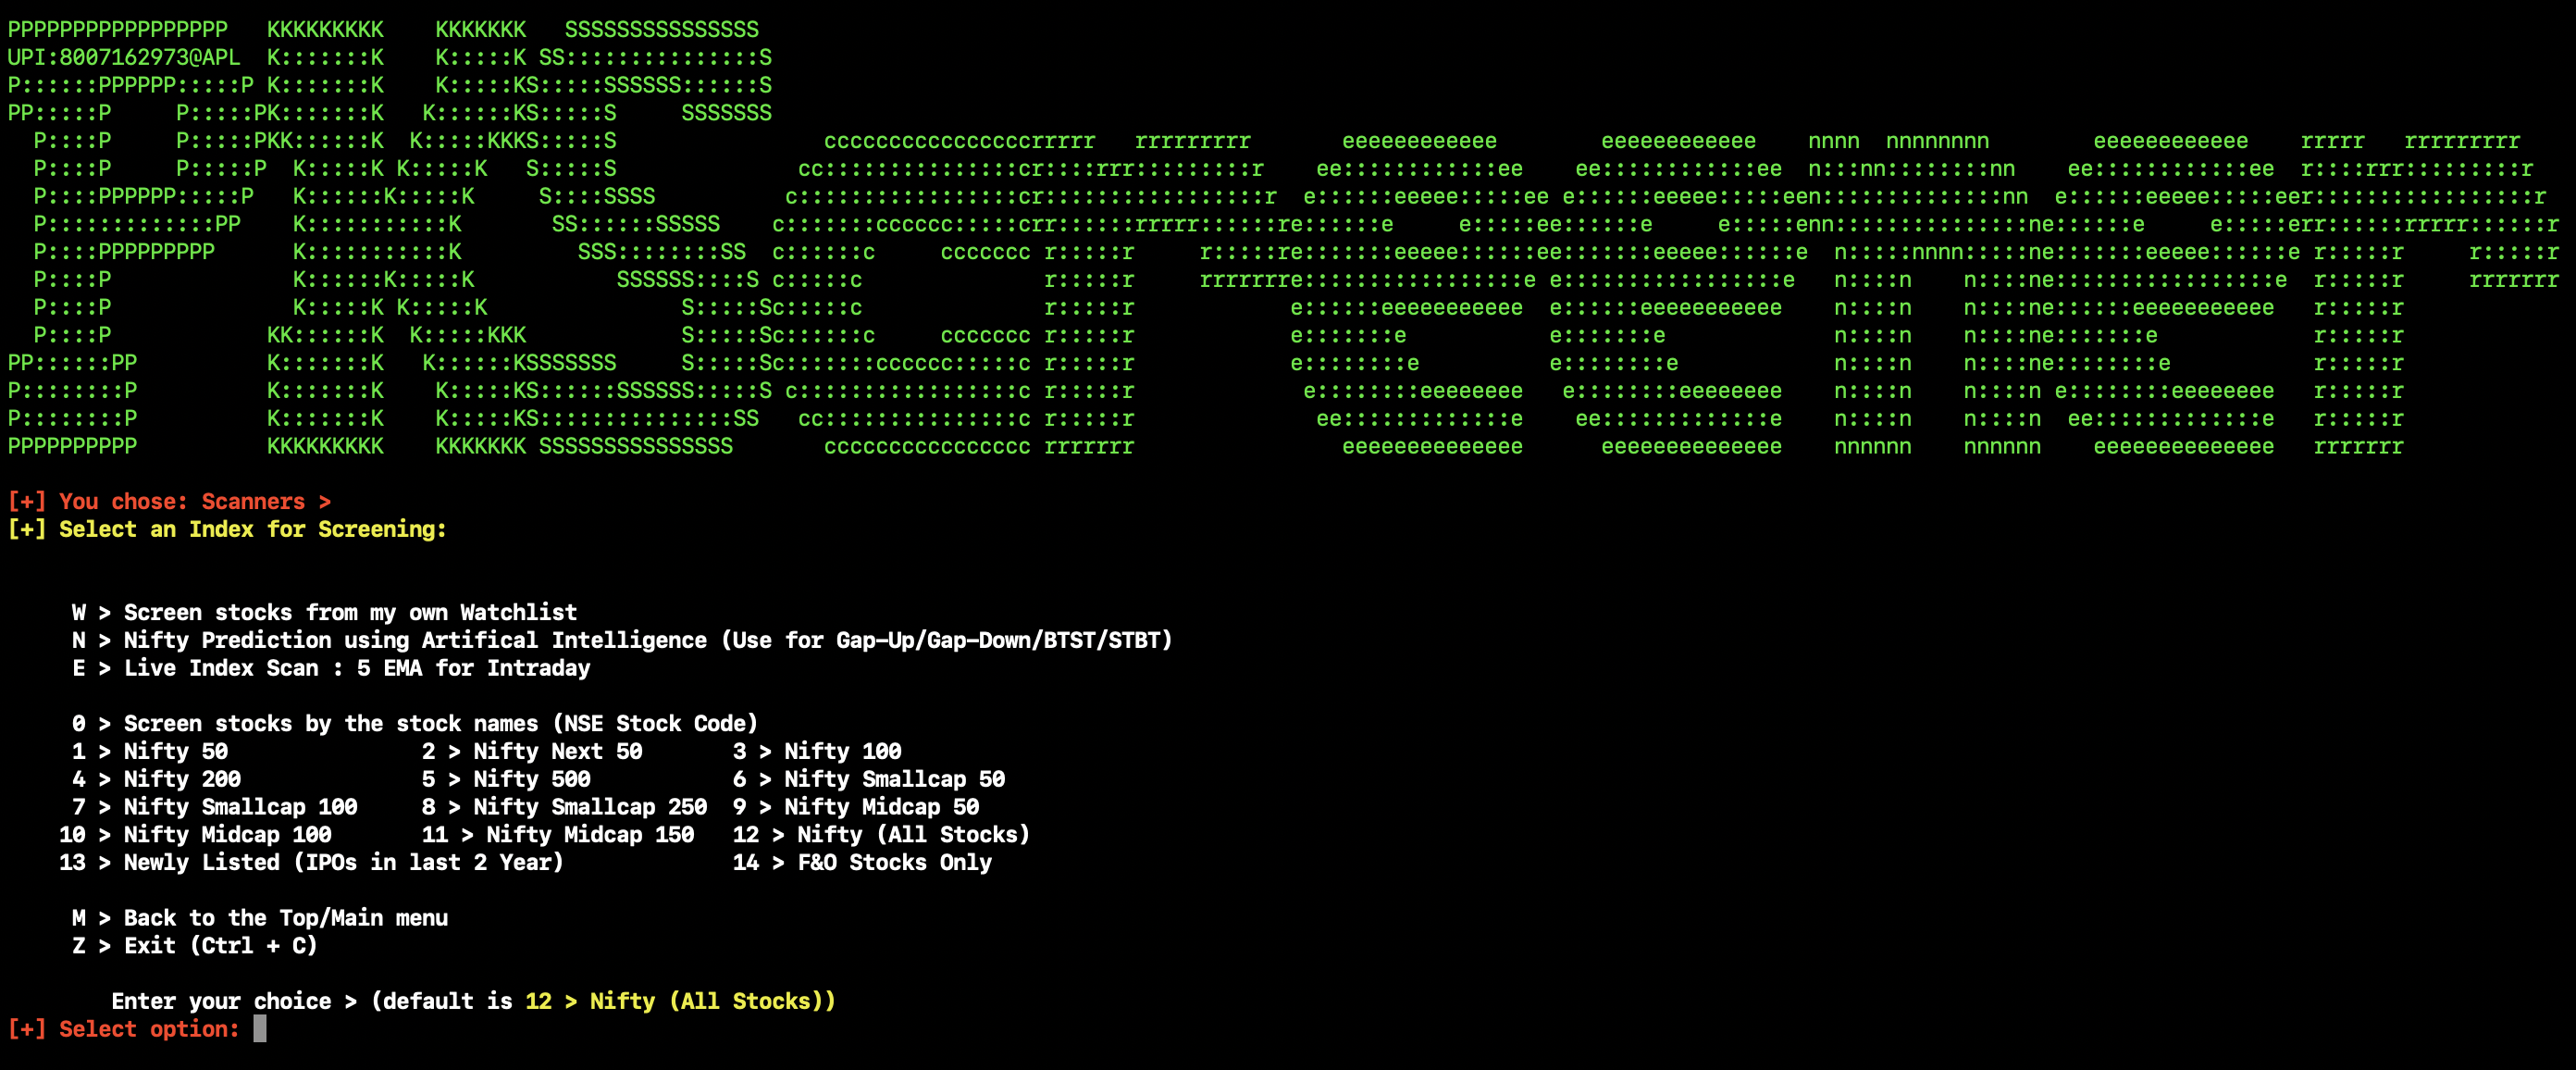
H > Help / About DeveloperMultiple Indices to choose from:
     W > Screen stocks from my own Watchlist
     N > Nifty Prediction using Artifical Intelligence (Use for Gap-Up/Gap-Down/BTST/STBT)
     E > Live Index Scan : 5 EMA for Intraday

     0 > Screen stocks/index by the stock/index names (NSE Stock Code, e.g. SBIN,BANKINDIA or Yahoo Finance index symbol, e.g. ^NSEI, ^NSEBANK, ^BSESN)
     1 > Nifty 50           2 > Nifty Next 50       3 > Nifty 100
     4 > Nifty 200          5 > Nifty 500           6 > Nifty Smallcap 50
     7 > Nifty Smallcap 100 8 > Nifty Smallcap 250  9 > Nifty Midcap 50
    10 > Nifty Midcap 100   11 > Nifty Midcap 150   12 > Nifty (All Stocks)
    13 > Newly Listed (IPOs in last 2 Year)             14 > F&O Stocks Only

     15 > NASDAQ
Followin scanners are already implemented.
     0 > Full Screening (Shows Technical Parameters without any criterion)
     1 > Probable Breakouts/Breakdowns      2 > Today's Breakouts/Breakdowns
     3 > Consolidating stocks               4 > Lowest Volume in last N-days (Early Breakout Detection)
     5 > RSI screening                      6 > Reversal Signals
     7 > Stocks making Chart Patterns       8 > CCI outside of the given range
     9 > Volume gainers                     10 > Closing at least 2% up since last 3 days
    11 > Short term bullish (Ichimoku)      12 > N-Minute Price & Volume breakout(Intraday)
    13 > Bullish RSI & MACD                 14 > NR4 Daily Today
    15 > 52 week low breakout(today)(Sell)  16 > 10 days low breakout(Sell)
    17 > 52 week high breakout(today)       18 > Bullish Aroon(14) Crossover
    19 > MACD Histogram x below 0 (Sell)    20 > Bullish for next day
    21 > MF/FIIs Popular Stocks             22 > View Stock Performance
    23 > Breaking out now                   24 > Higher Highs,Lows & Close (SuperTrend)
    25 > Lower Highs,Lows (Watch for Rev.)  26 > Stocks with stock-split/bonus/dividends
    27 > ATR Cross                          28 > Bullish Higher Opens
    29 > Intraday Bid/Ask Build-up          30 > ATR Trailing Stops(Swing Paper Trading)
    31 > High Momentum(RSI,MFI,CCI)
Running Piped Scanners
https://github.com/pkjmesra/PKScreener/assets/1358101/9e579371-1035-400a-9f65-139d8407f6c7
Multiple pre-defined piped scanners
     1 > Volume Scanners | High Momentum | Breaking Out Now | ATR Cross         2 > Volume Scanners | High Momentum | ATR Cross
     3 > Volume Scanners | High Momentum                                        4 > Volume Scanners | ATR Cross
     5 > Volume Scanners | High Bid/Ask Build Up                                6 > Volume Scanners | ATR Cross | ATR Trailing Stops
     7 > Volume Scanners | ATR Trailing Stops                                   8 > High Momentum | ATR Cross
     9 > High Momentum | ATR Trailing Stop                                      10 > ATR Cross | ATR Trailing Stop
    11 > TTM Sqeeze Buy | Intraday RSI b/w 0 to 54                              12 > Volume Scanners | High Momentum | Breaking Out Now | ATR Cross | Intraday RSI b/w 0 to 54
    13 > Volume Scanners | ATR Cross | Intraday RSI b/w 0 to 54                 14 > VCP (Mark Minervini) | Chart Patterns | MA Support
    15 > VCP | Chart Patterns | MA Support                                      16 > Already Breaking out | VCP (Minervini) | Chart Patterns | MA Support
    17 > ATR Trailing Stops | VCP (Minervini)                                   18 > VCP | ATR Trailing Stops
    19 > Nifty 50,Nifty Bank | VCP | ATR Trailing Stops
How to use on your own local Windows/Linux/Macbook laptop?
Using docker, running within docker container
- Download and install docker desktop: https://docs.docker.com/get-docker/
- After installation, launch/run docker desktop and if it asks, login using your docker credentials.
- Launch any command line (for example, cmd on windows or terminal on Mac) and type
docker pull pkjmesra/pkscreener:latestThen type
docker run -it pkjmesra/pkscreener:latestThe option
-iwill open thepkscreenerin interactive mode within docker.-twill allocate a pseudo terminal for you so you can begin to usepkscreener
Special notes on vulnerabilities shown in the docker image/container
Please keep in mind that only because the container/image shows a vulnerability, it does not mean that it exists in this particular image.
- If you see a critical vulnerability being shown for git, it's ONLY IF we use git with v2.13 or below AND we use git submodule. In case of PKScreener, both are false. We use git >= 2.45 and we DO NOT use git submodules. See https://nvd.nist.gov/vuln/detail/CVE-2024-32002
- If you see high severity vulnerability for pip, it's ONLY IF we use a private indexed repository. In our case, we only use PyPi - a public python library repository. See https://nvd.nist.gov/vuln/detail/CVE-2018-20225.
- If you see high severity vulnerability for usage of library Pillow, it's ONLY IF we try to generate an image containing text that can uncontrollably lengthy. In PKScreener, the image is NEVER generated locally on your laptop or docker container. It is generated only when running in telegram-bot for morning/afternoon analysis alerts. Additionally, there are checks to ensure we never go beyond the maximum size of the number of columns in the analysis tables. To conclude, the image generation module never gets activated on docker/locally on your laptop. See https://nvd.nist.gov/vuln/detail/CVE-2023-44271
The story is similar for other low severity vulnerabilities that docker might show. If you're genuinely concerned, you can search with the respective CVE # in the NIST database to understand more or create an issue https://github.com/pkjmesra/PKScreener/issues . We keep reviewing all vulnerabilties regularly and fix those immediately if at all they are likely to impact us or our users.
Installing the latest version from PyPi.
- Go ahead and install using
pip install pkscreener. The releases page also has the latest wheels for multiple platforms. - This should install all of the major dependencies, except maybe, TA-Lib.
- This app can still run without TA-Lib, but if you need to install TA-Lib for technical indicators (which otherwise is used from
pandas_tain the absence of TA-Lib), you can do this: Head to.github/dependencies/under this repo. Download the respective TA-Lib file/whl file and install either from the .whl file or from source. Check out any of the workflow files for steps to install TA-Lib.
For example:
For Windows: See https://github.com/pkjmesra/PKScreener/blob/c1e94ba3137915cb781161fa2d5fb69129940fd3/.github/workflows/w1-workflow-build-matrix.yml#L91-L101
For Mac: Run brew install ta-lib assuming you have homebrew installed.
For Ubuntu/Linux: See https://github.com/pkjmesra/PKScreener/blob/main/.github/workflows/w1-workflow-build-matrix.yml#L121-L132
- Now launch your favorite command line CLI and issue
pkscreener. This will launch the pkscreener executable.
Building from source repo
- Install python 3.9 for your OS/CPU. Download the installer from https://www.python.org/downloads/release/python-3913/#Files
- Just clone the repo with
git clone https://github.com/pkjmesra/PKScreener.git cd PKScreenerpip install -r requirements.txt.- (Optional) If you would like to have technical indicators evaluated using TA-Lib, go ahead and install TA-Lib as well.
pip3 install ta-lib. Please review additional steps to buil TA-Lib in the workflow files meant for your OS under .github > workflows and follow the line numbers from the previous section. cd pkscreener- Finally, from within the
pkscreenerdirectory, runpython pkscreenercli.py. Or just type/runpkscreener. You are all set.
Running the executables
-
Download the suitable file according to your OS.
-
Linux & Mac users should make sure that the
pkscreenercli.bin or pkscreenercli.runis havingexecutepermission. (chmod +x pkscreenercli.run) -
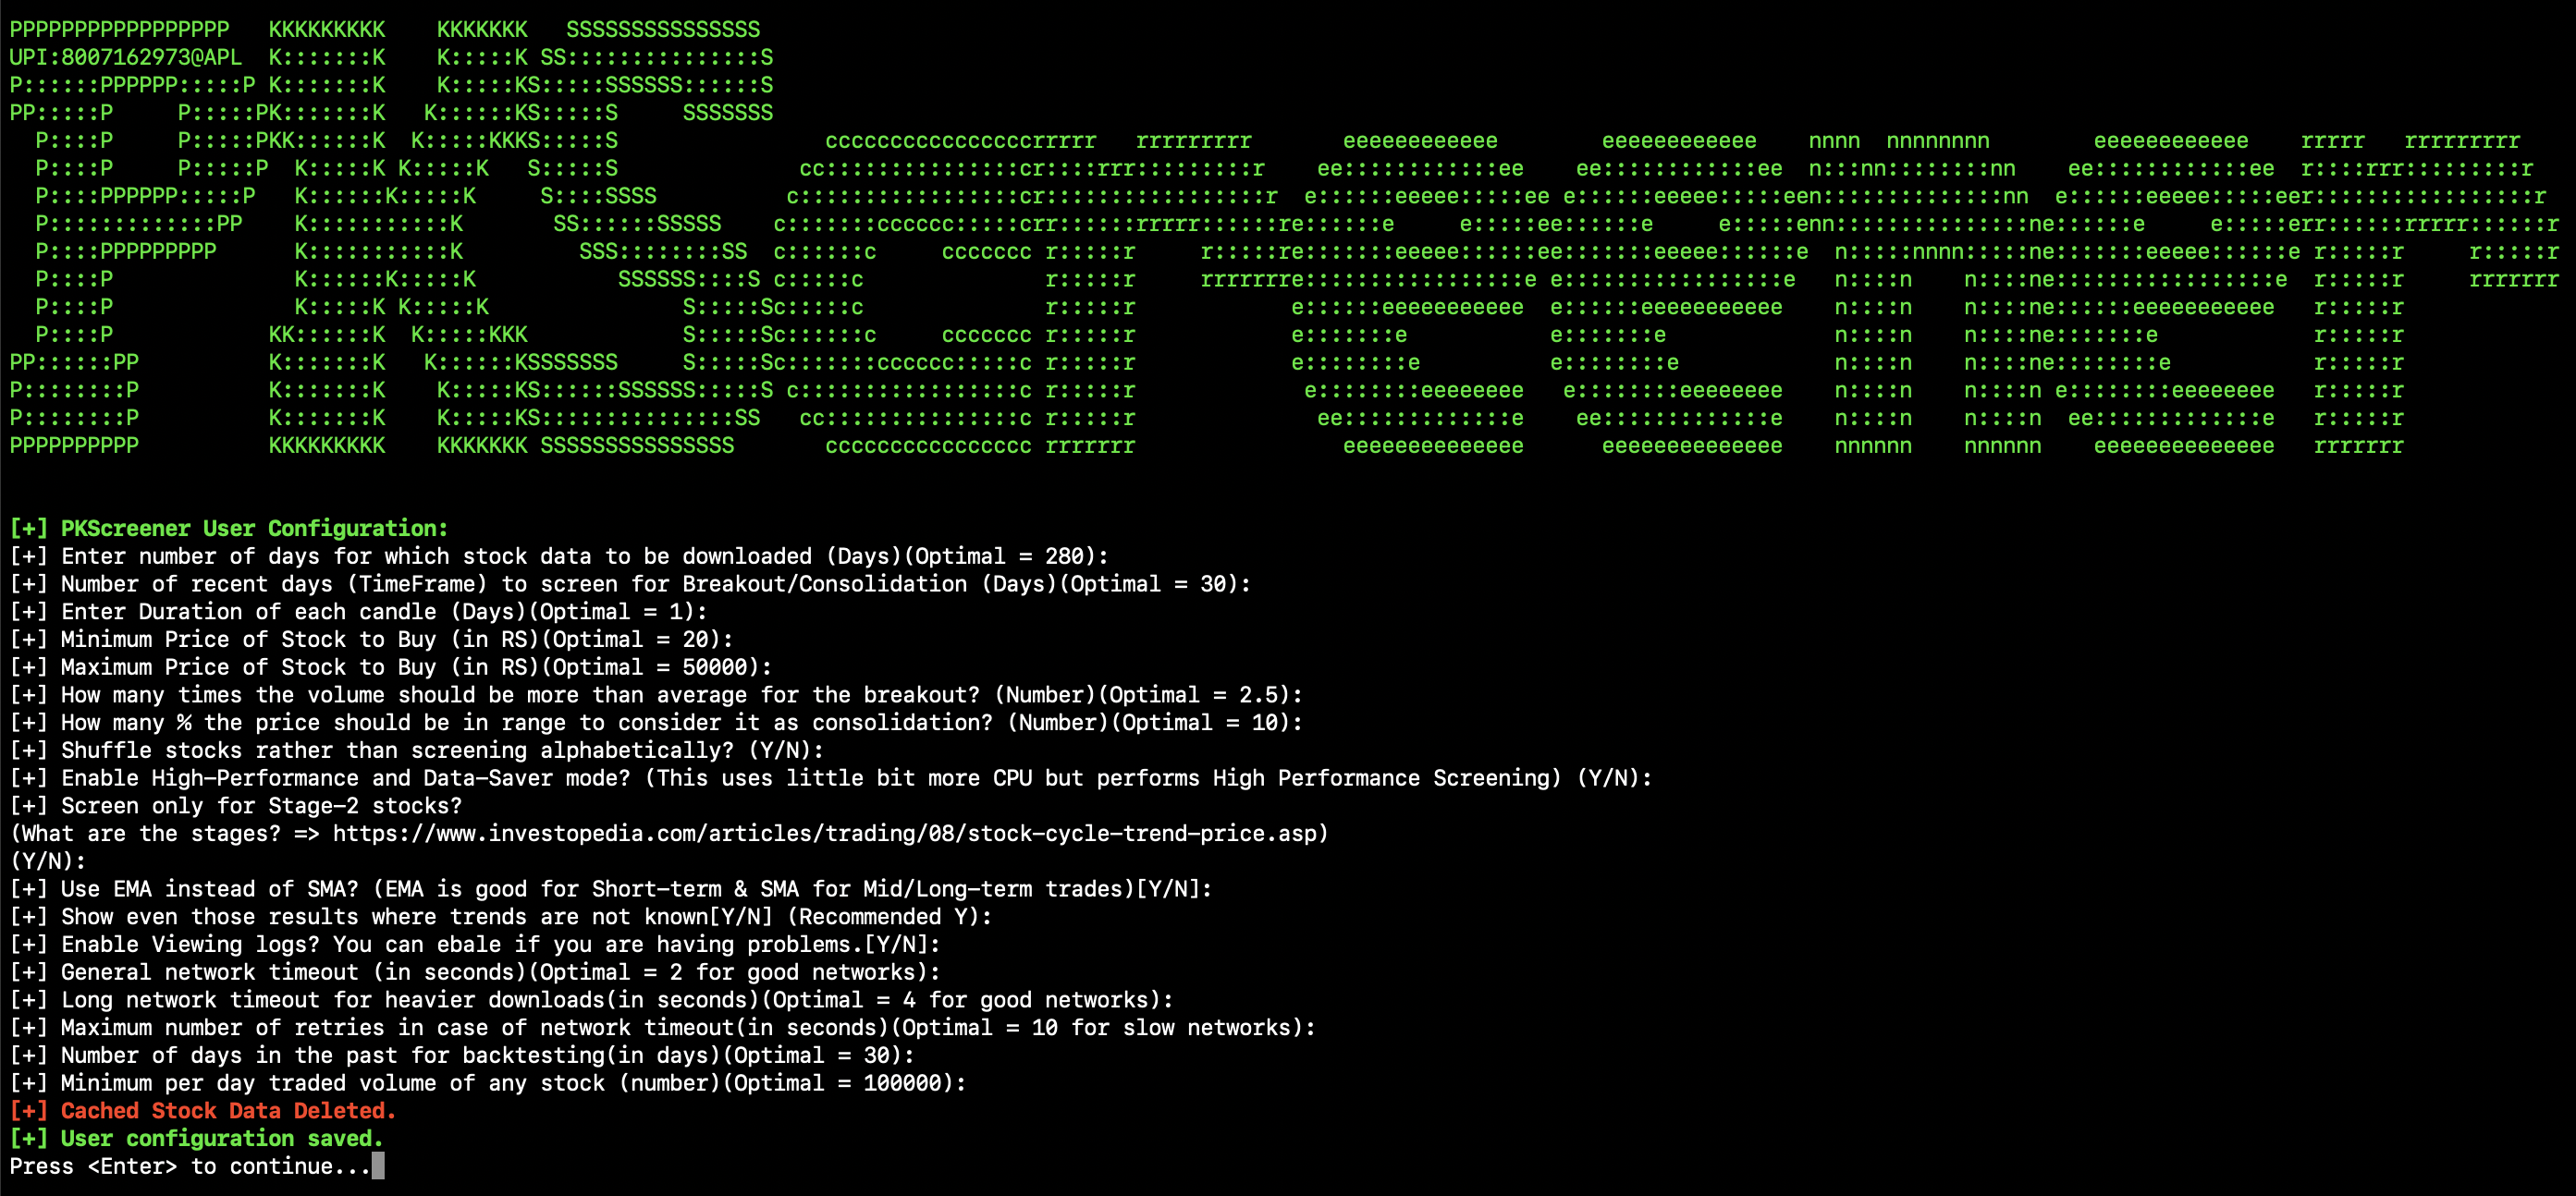
Run the file. Following window will appear.
-
Configure the parameters as per your requirement using
Option > E.
-
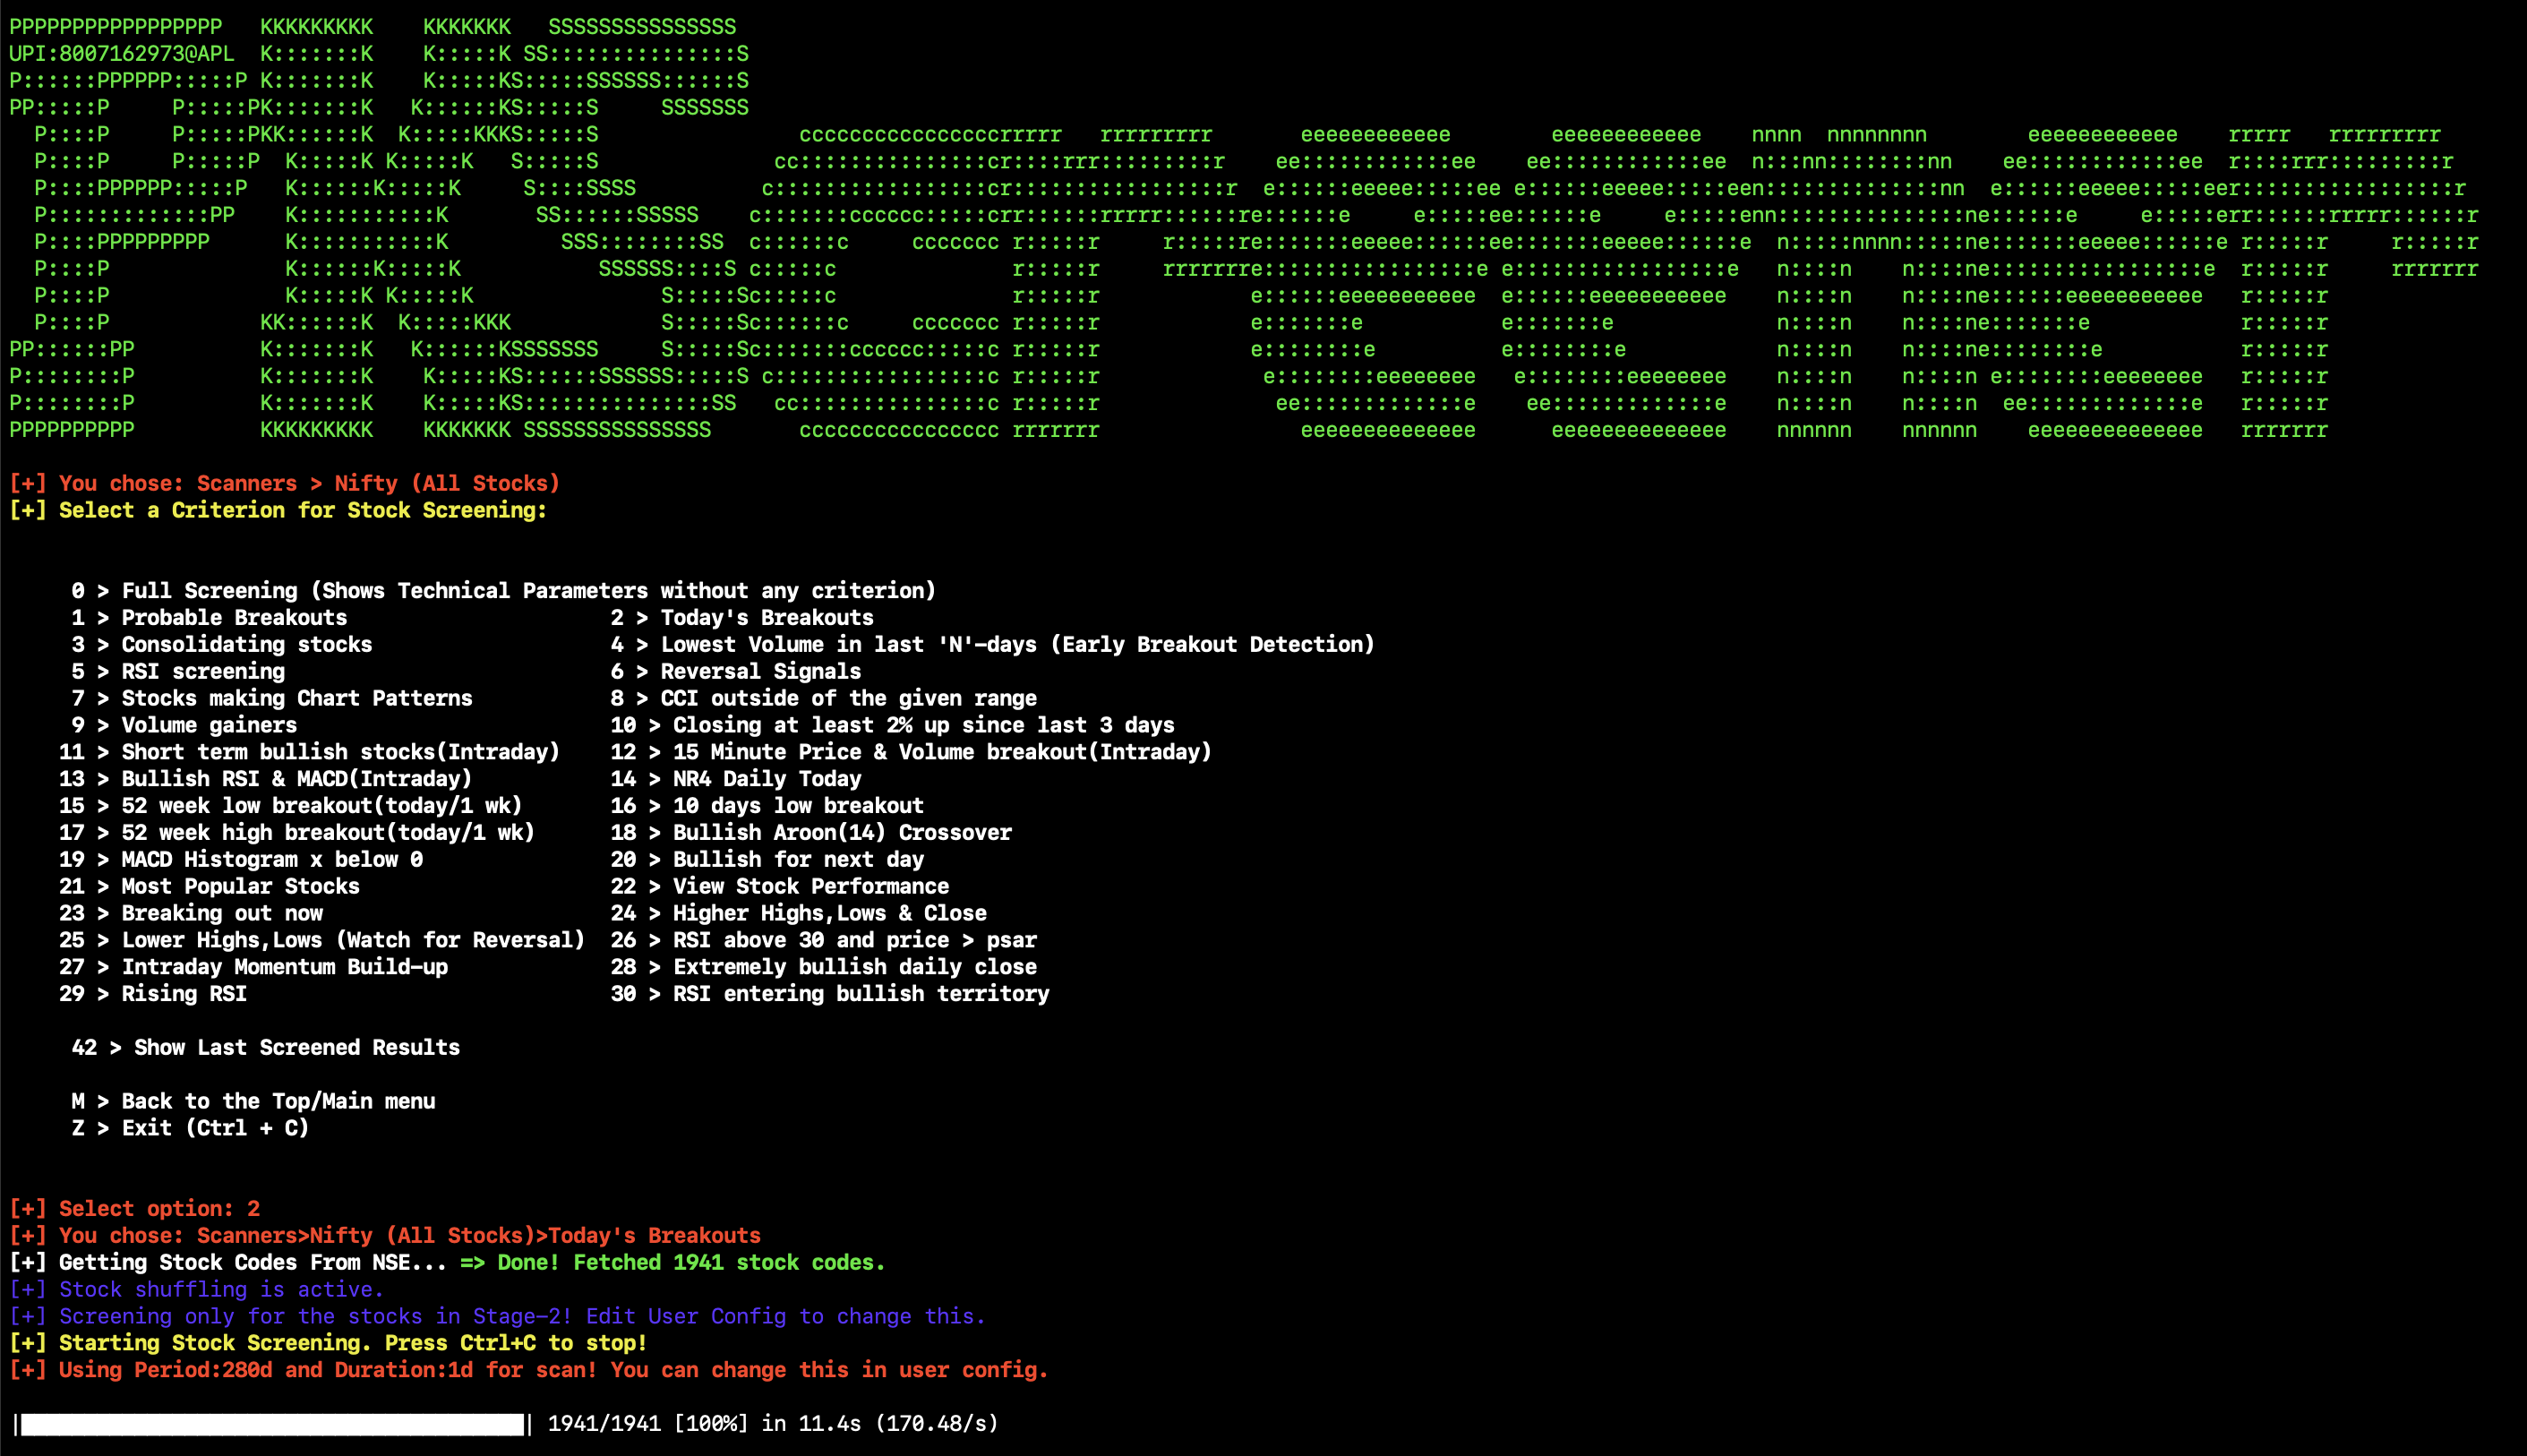
Scanner Menus the scanner menus for each level/sub-level
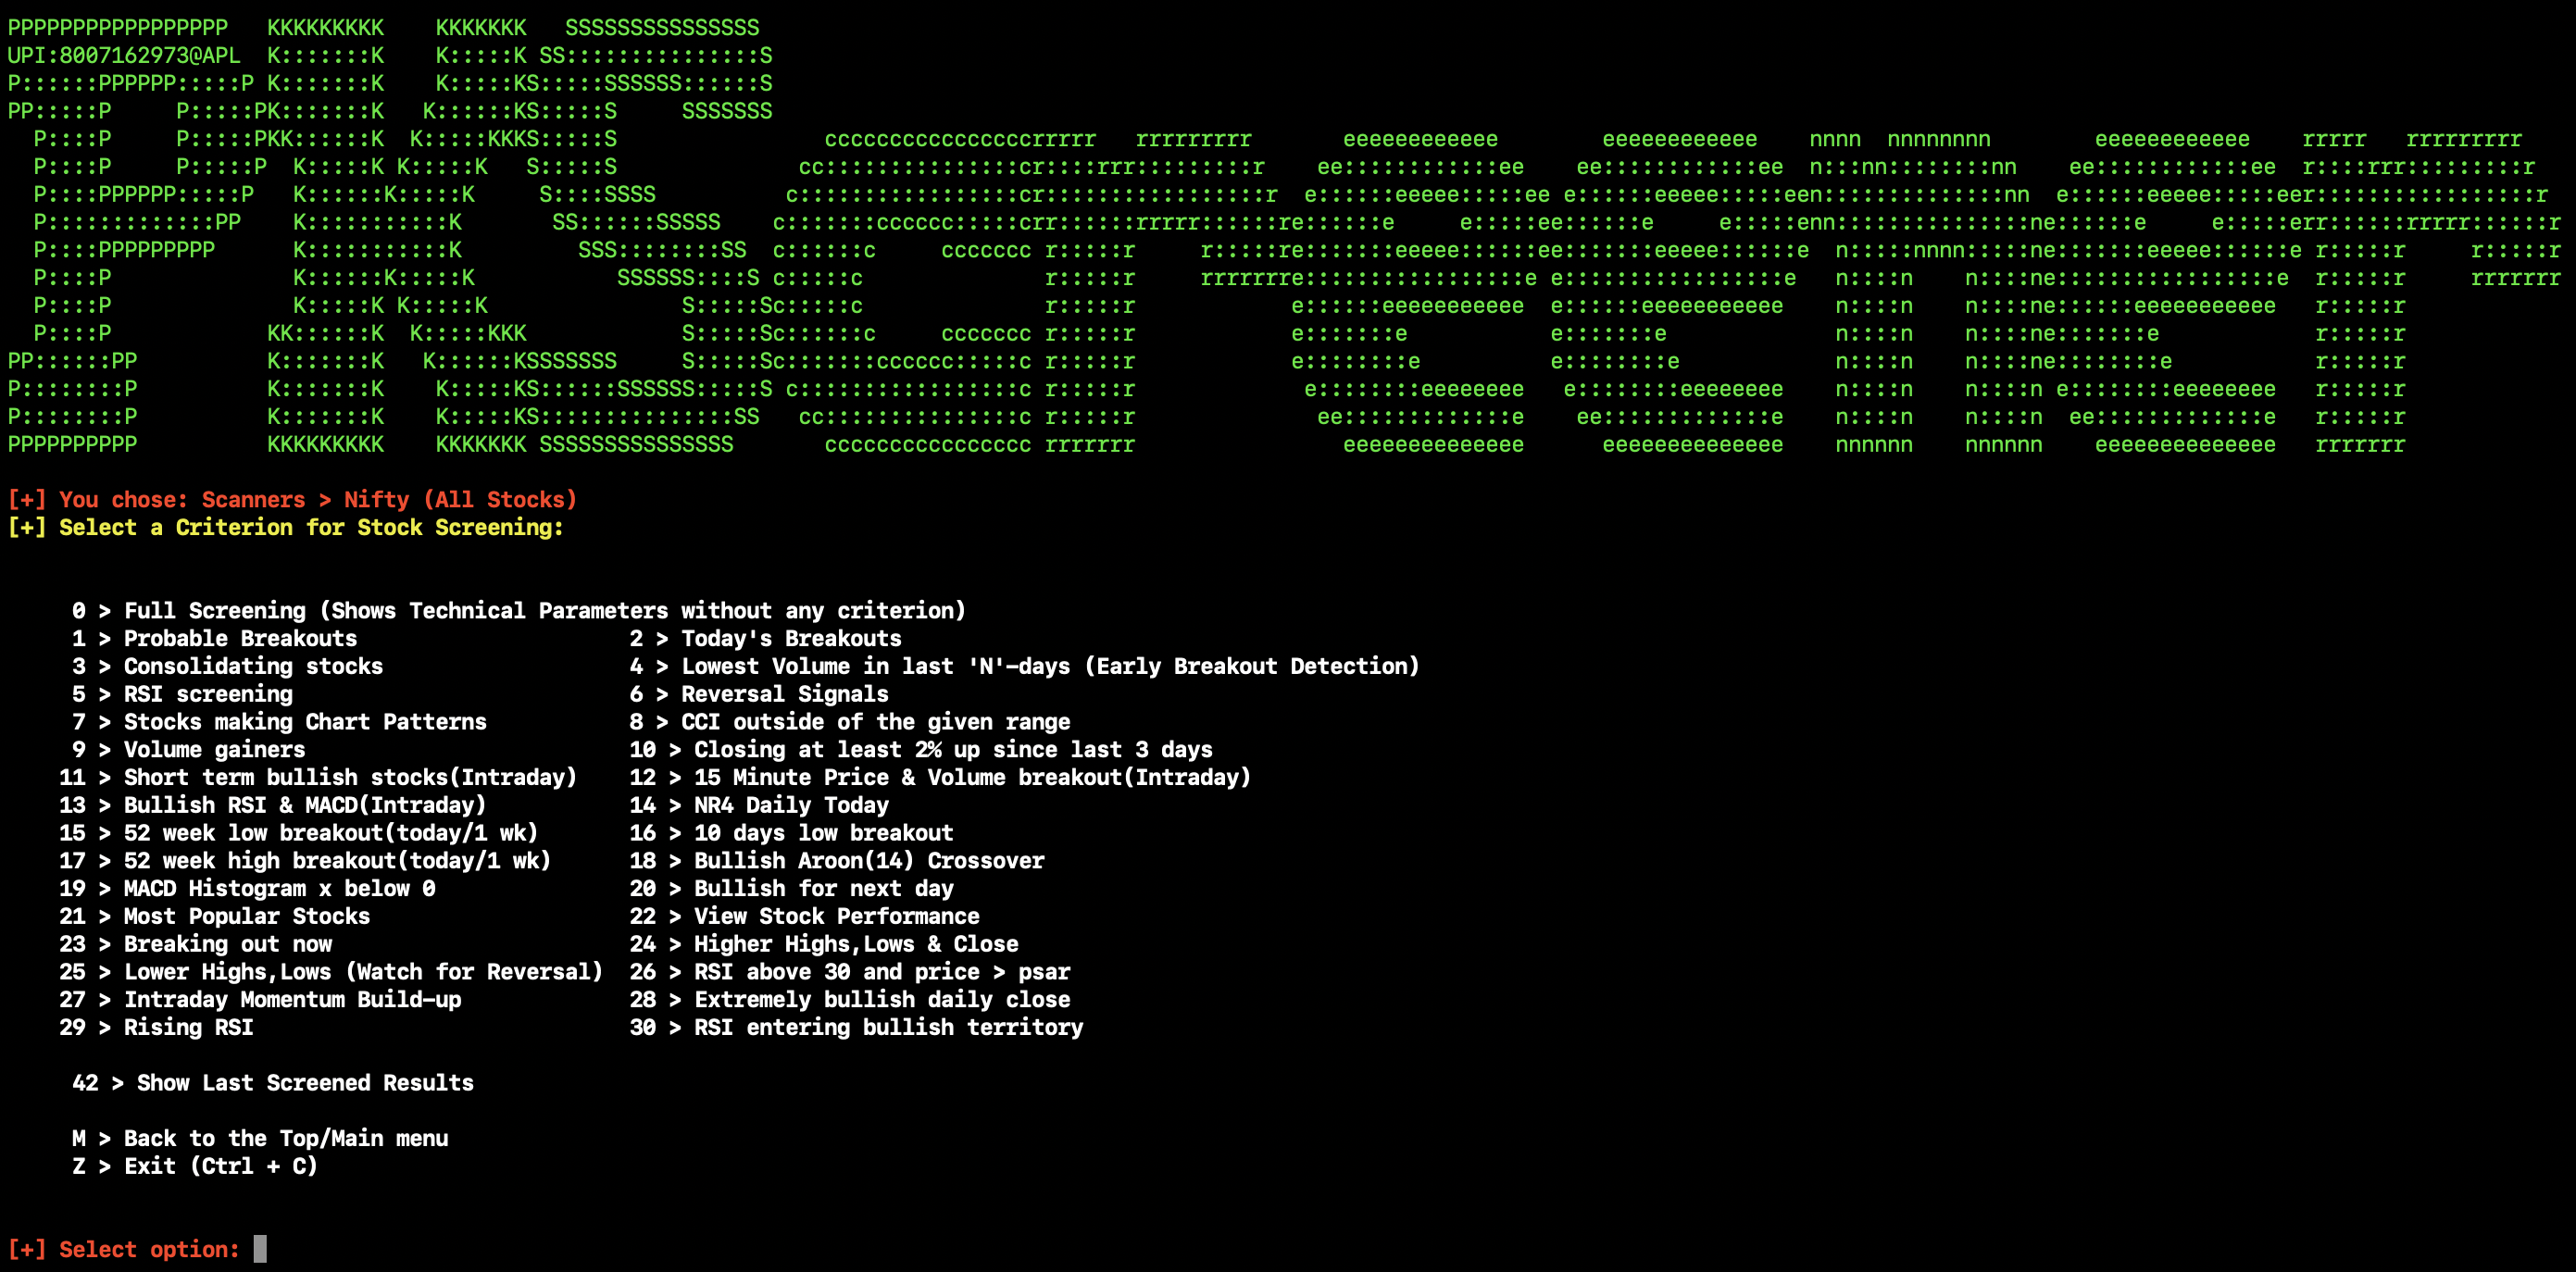
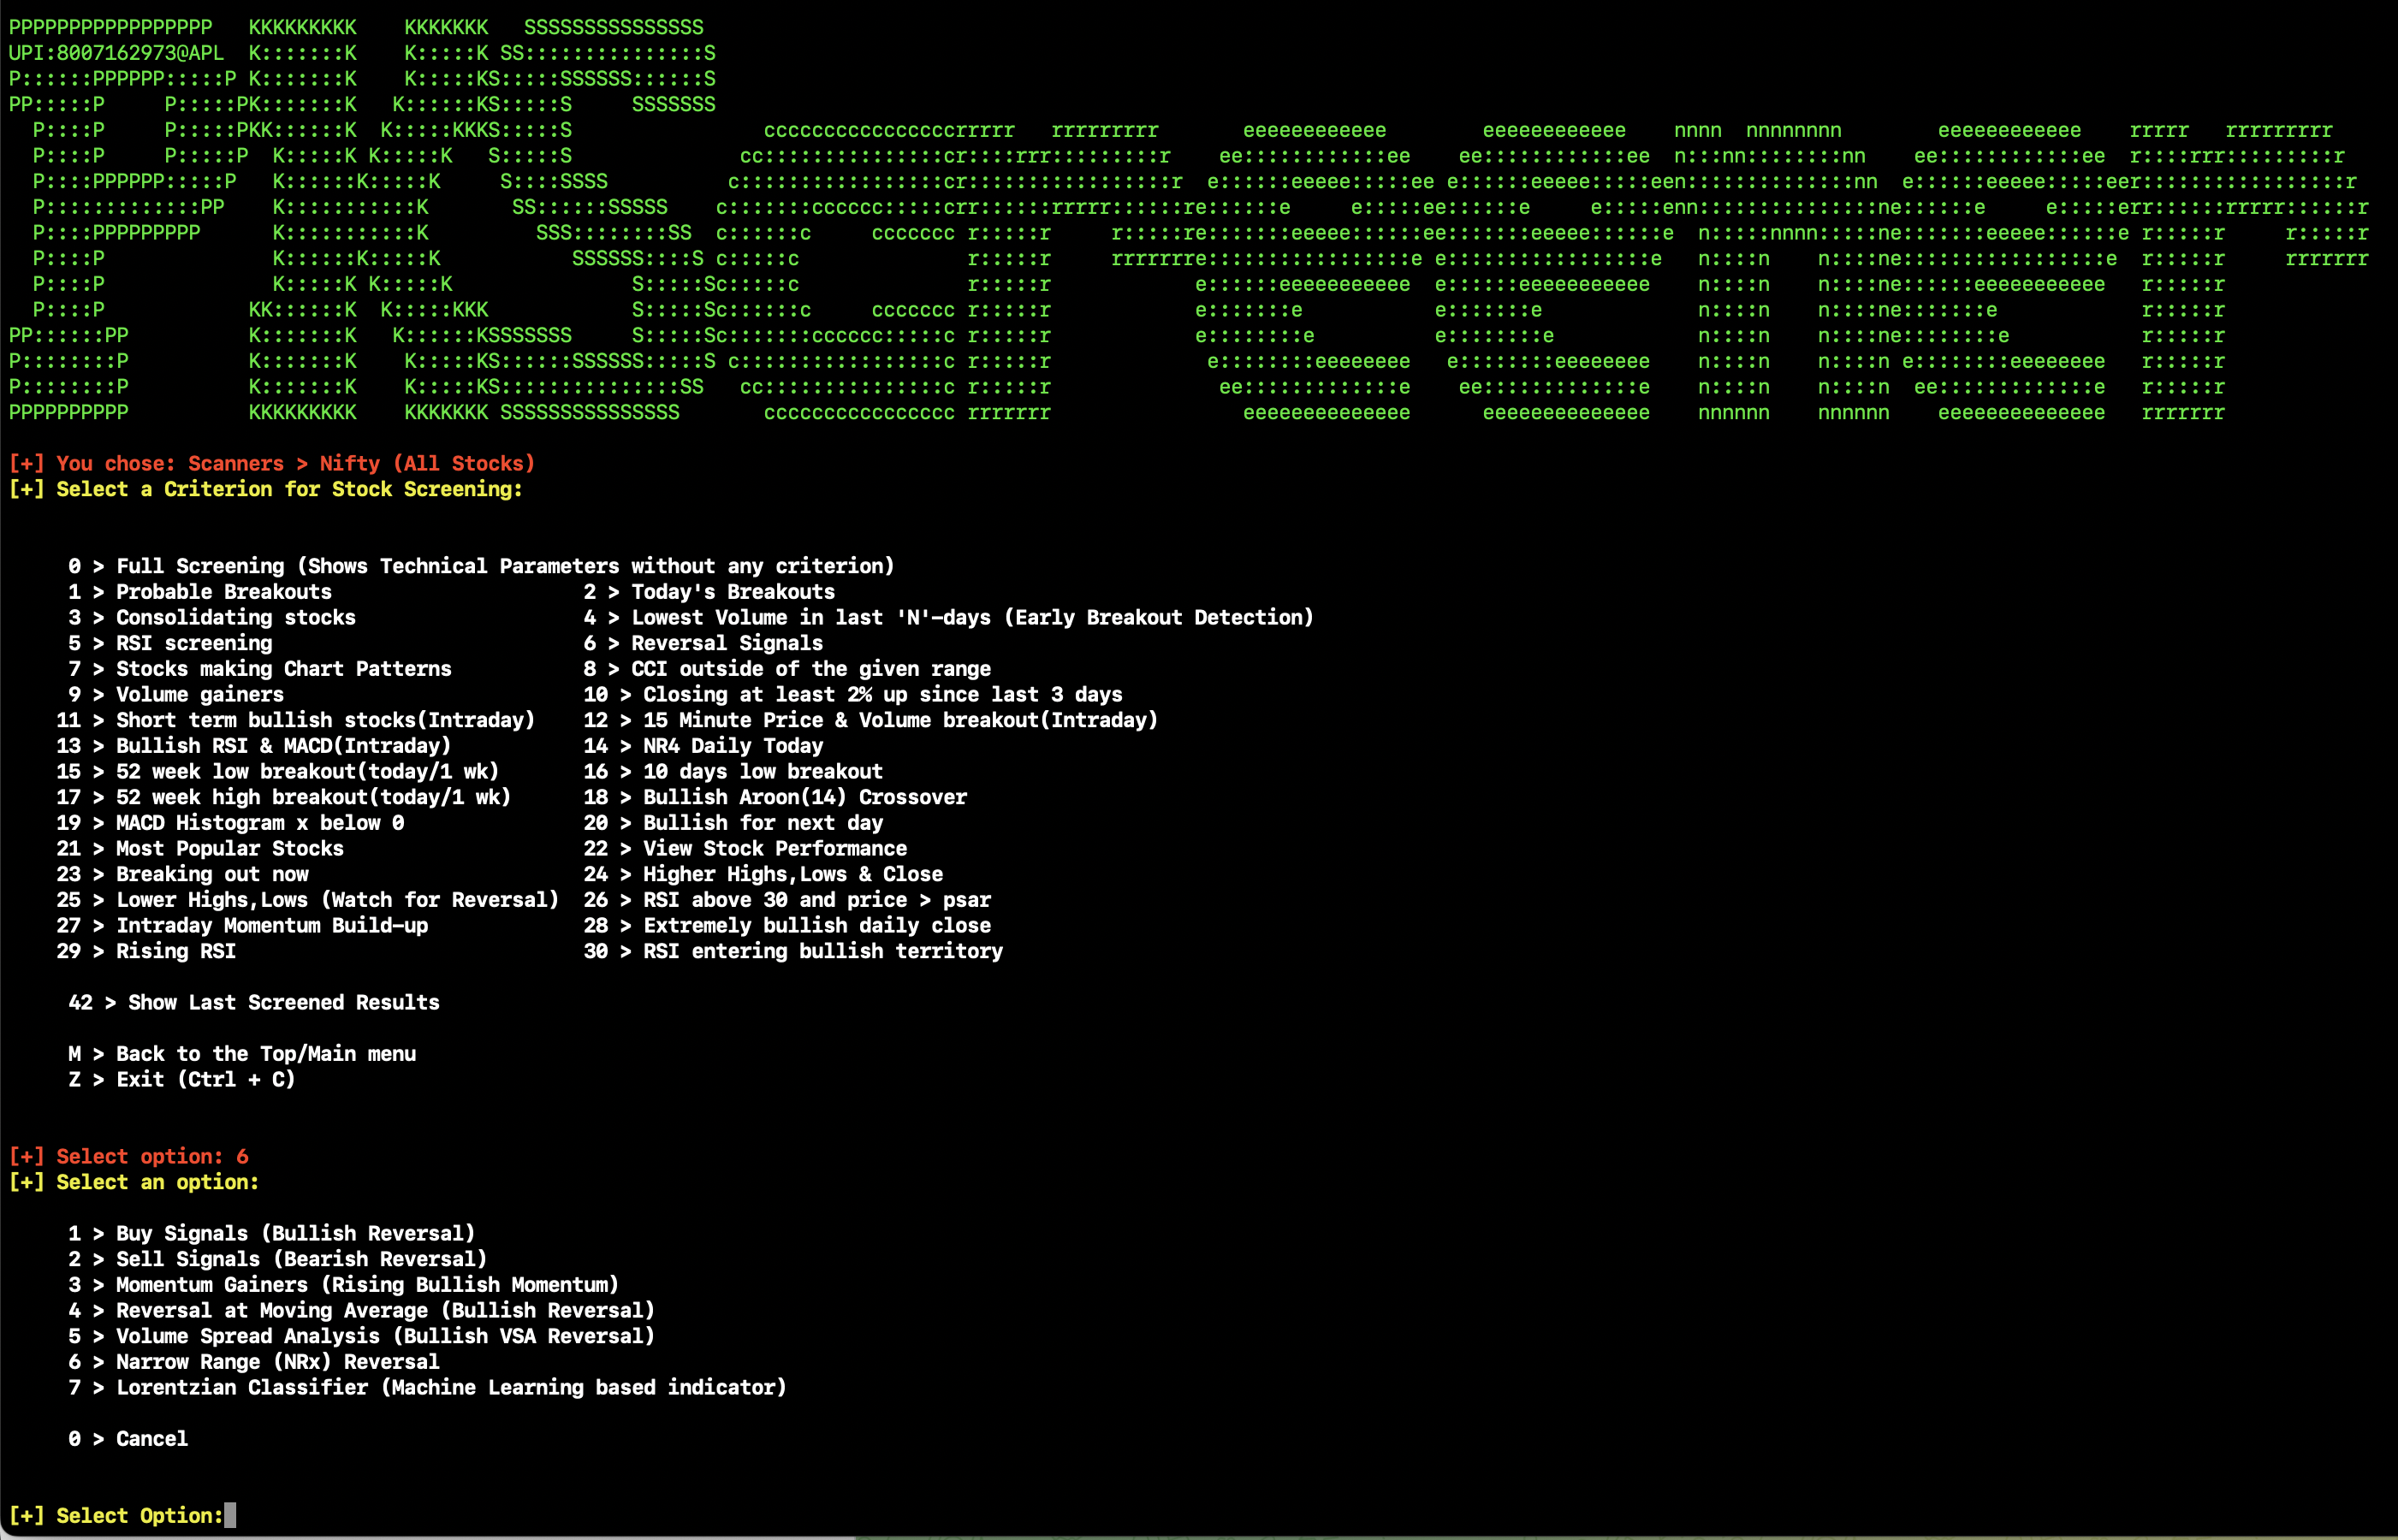
-
Following are the screenshots of screening and output results.
Results :
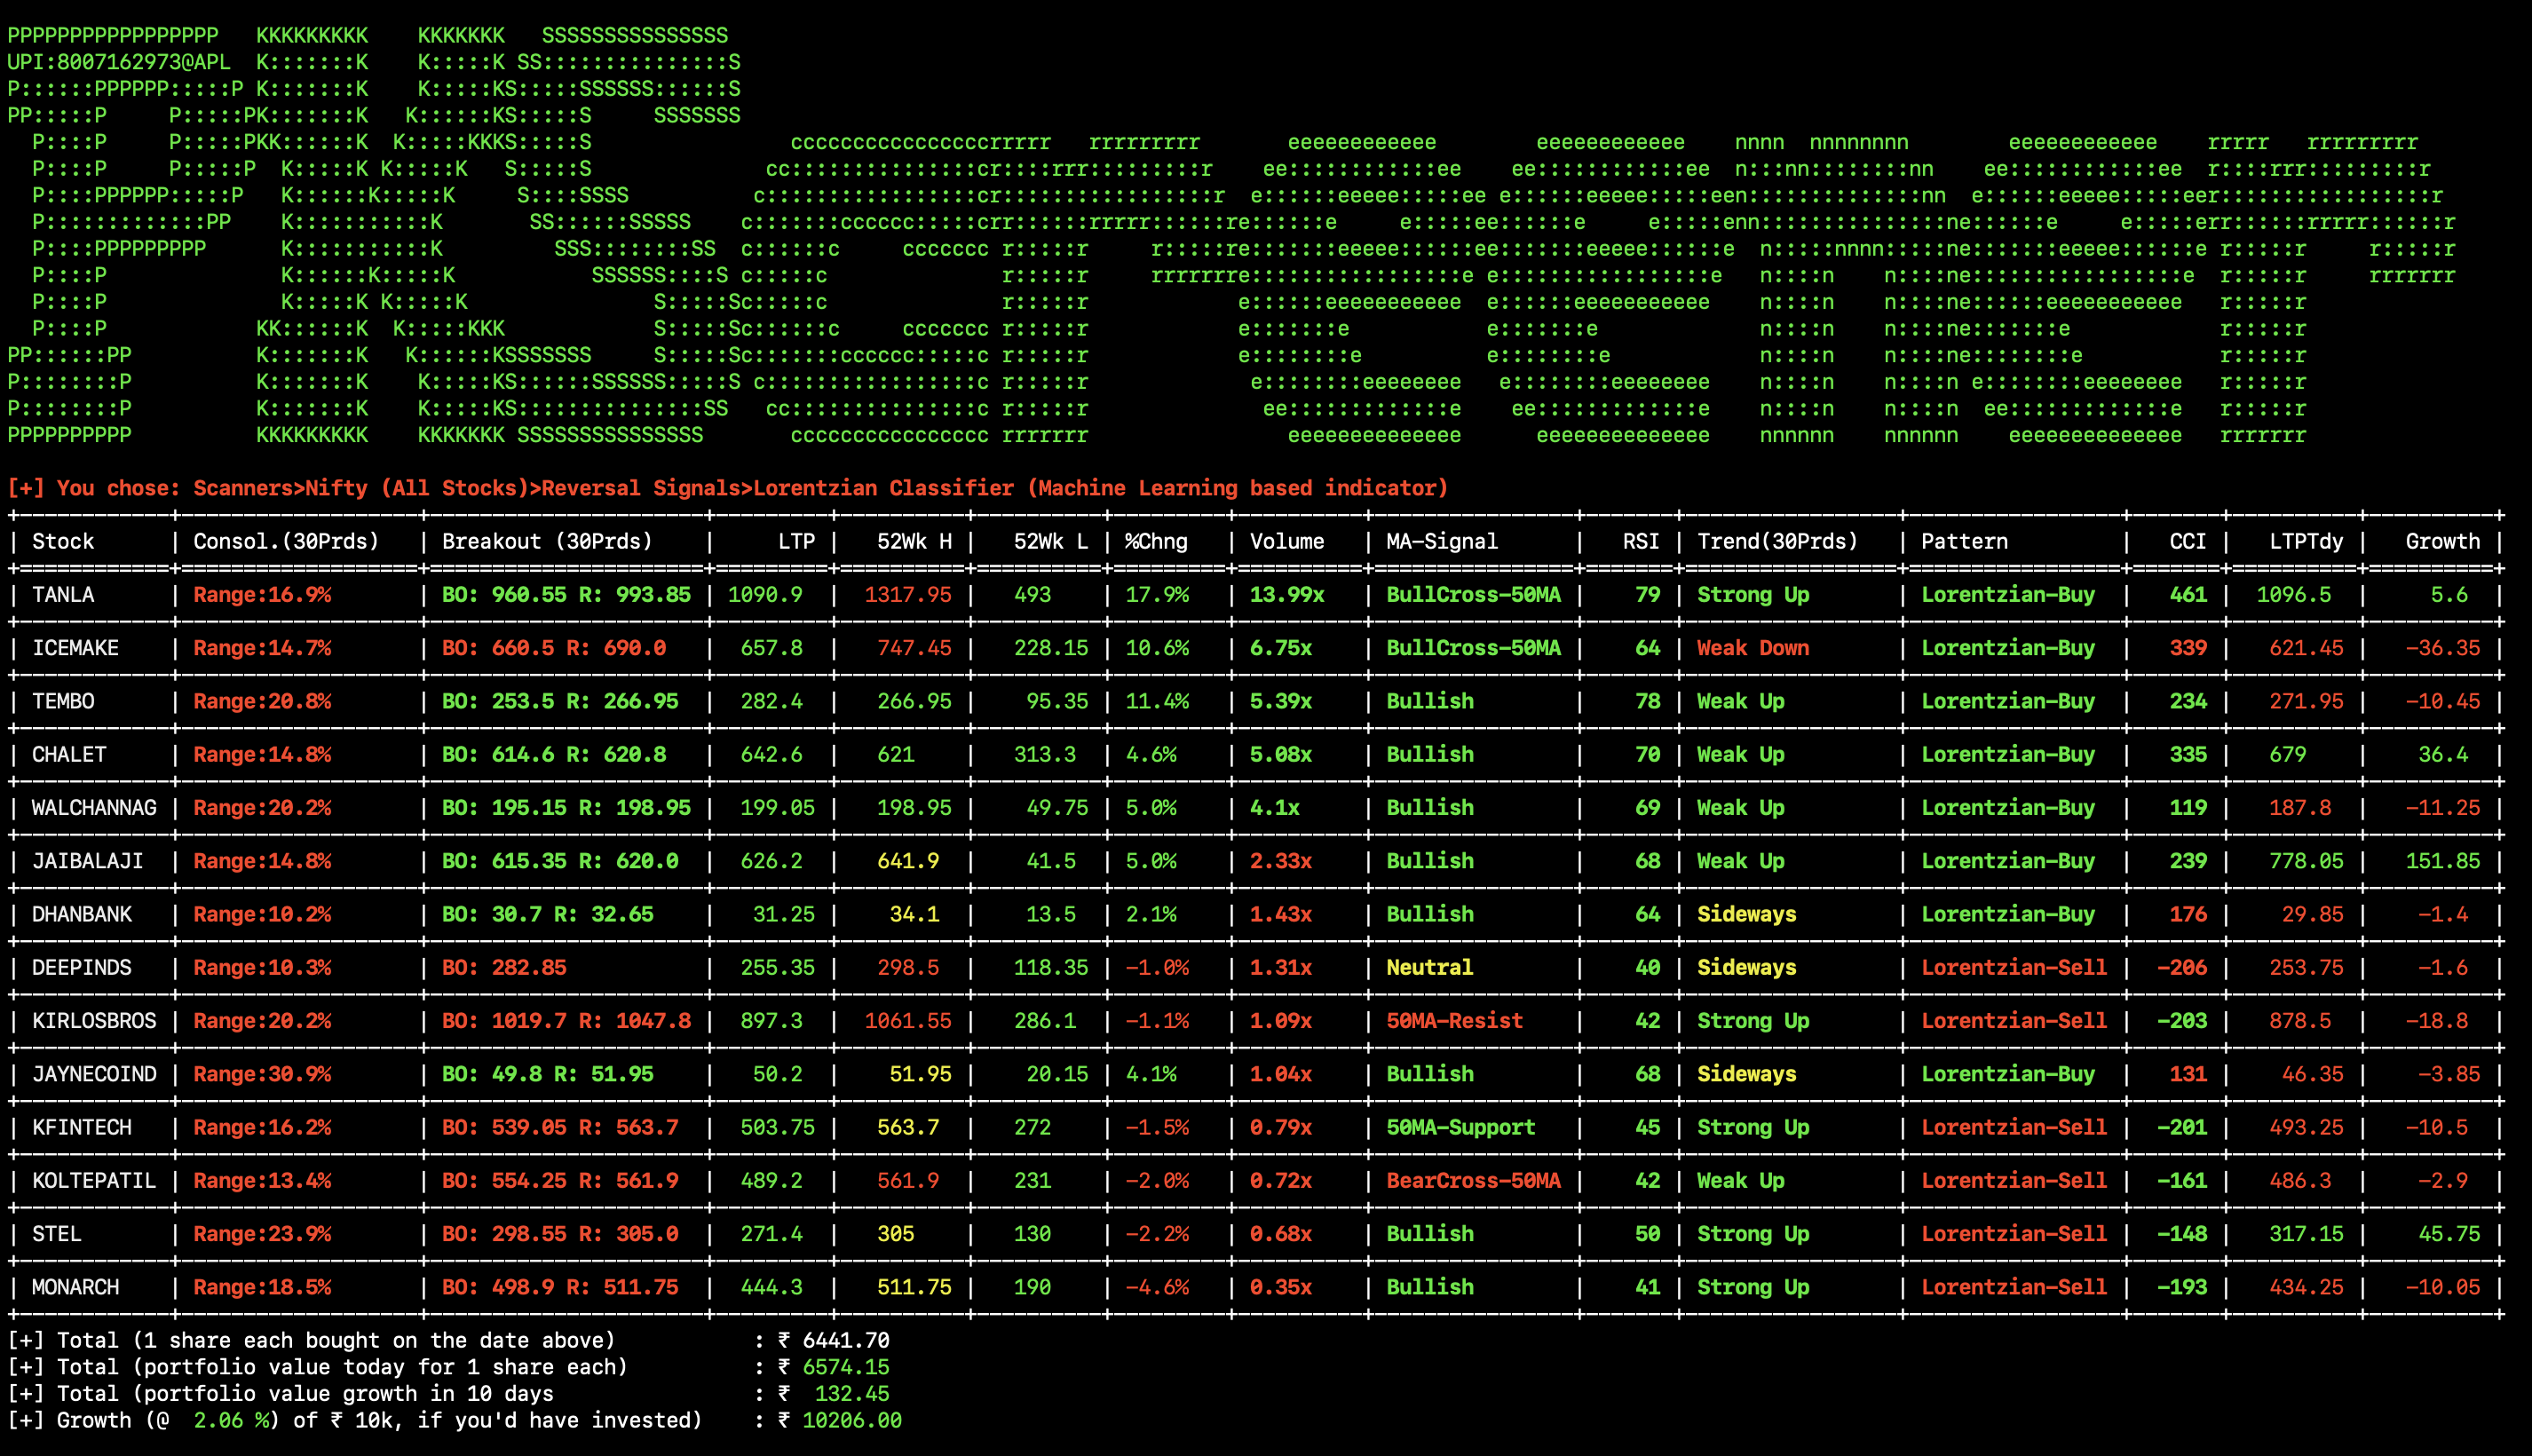
It also shows you how the chosen scan option has fared in the past. 1-Pd, 2-Pd means 1 day, 2 days from the date of scan in the past when those stocks came into the results of the chosen scan option.
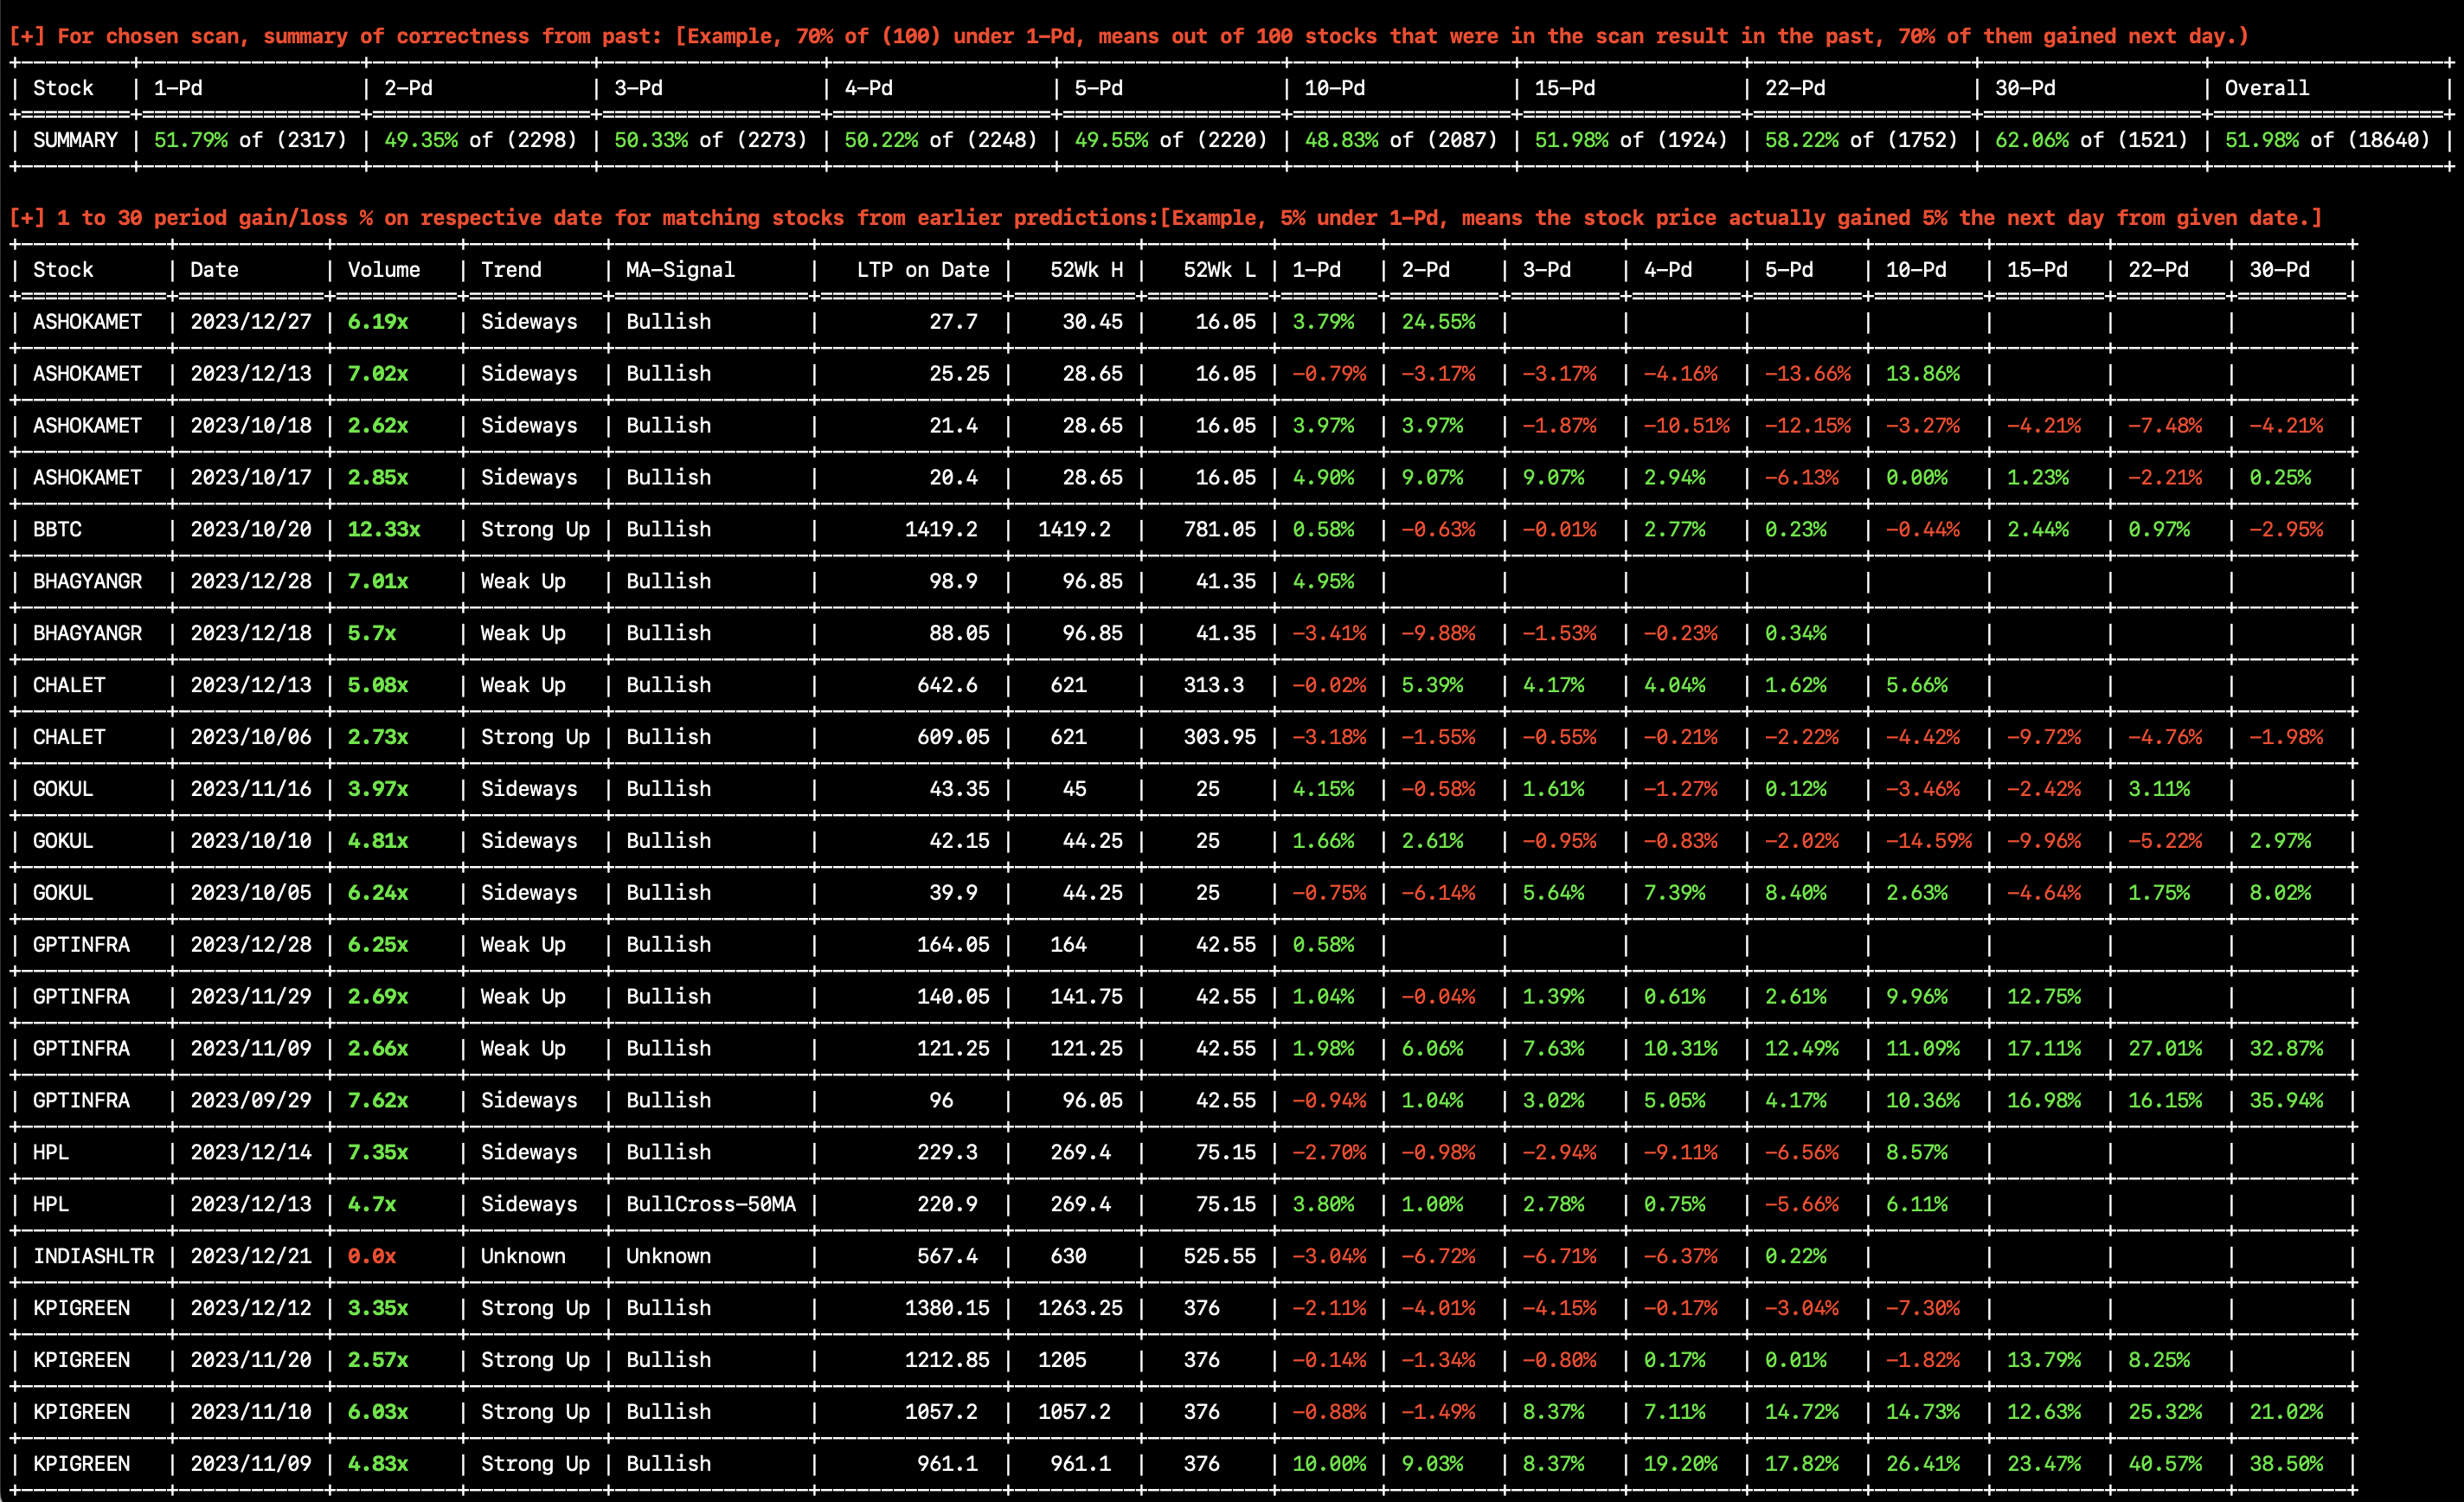
- Once done, you can also save the results in an excel file.
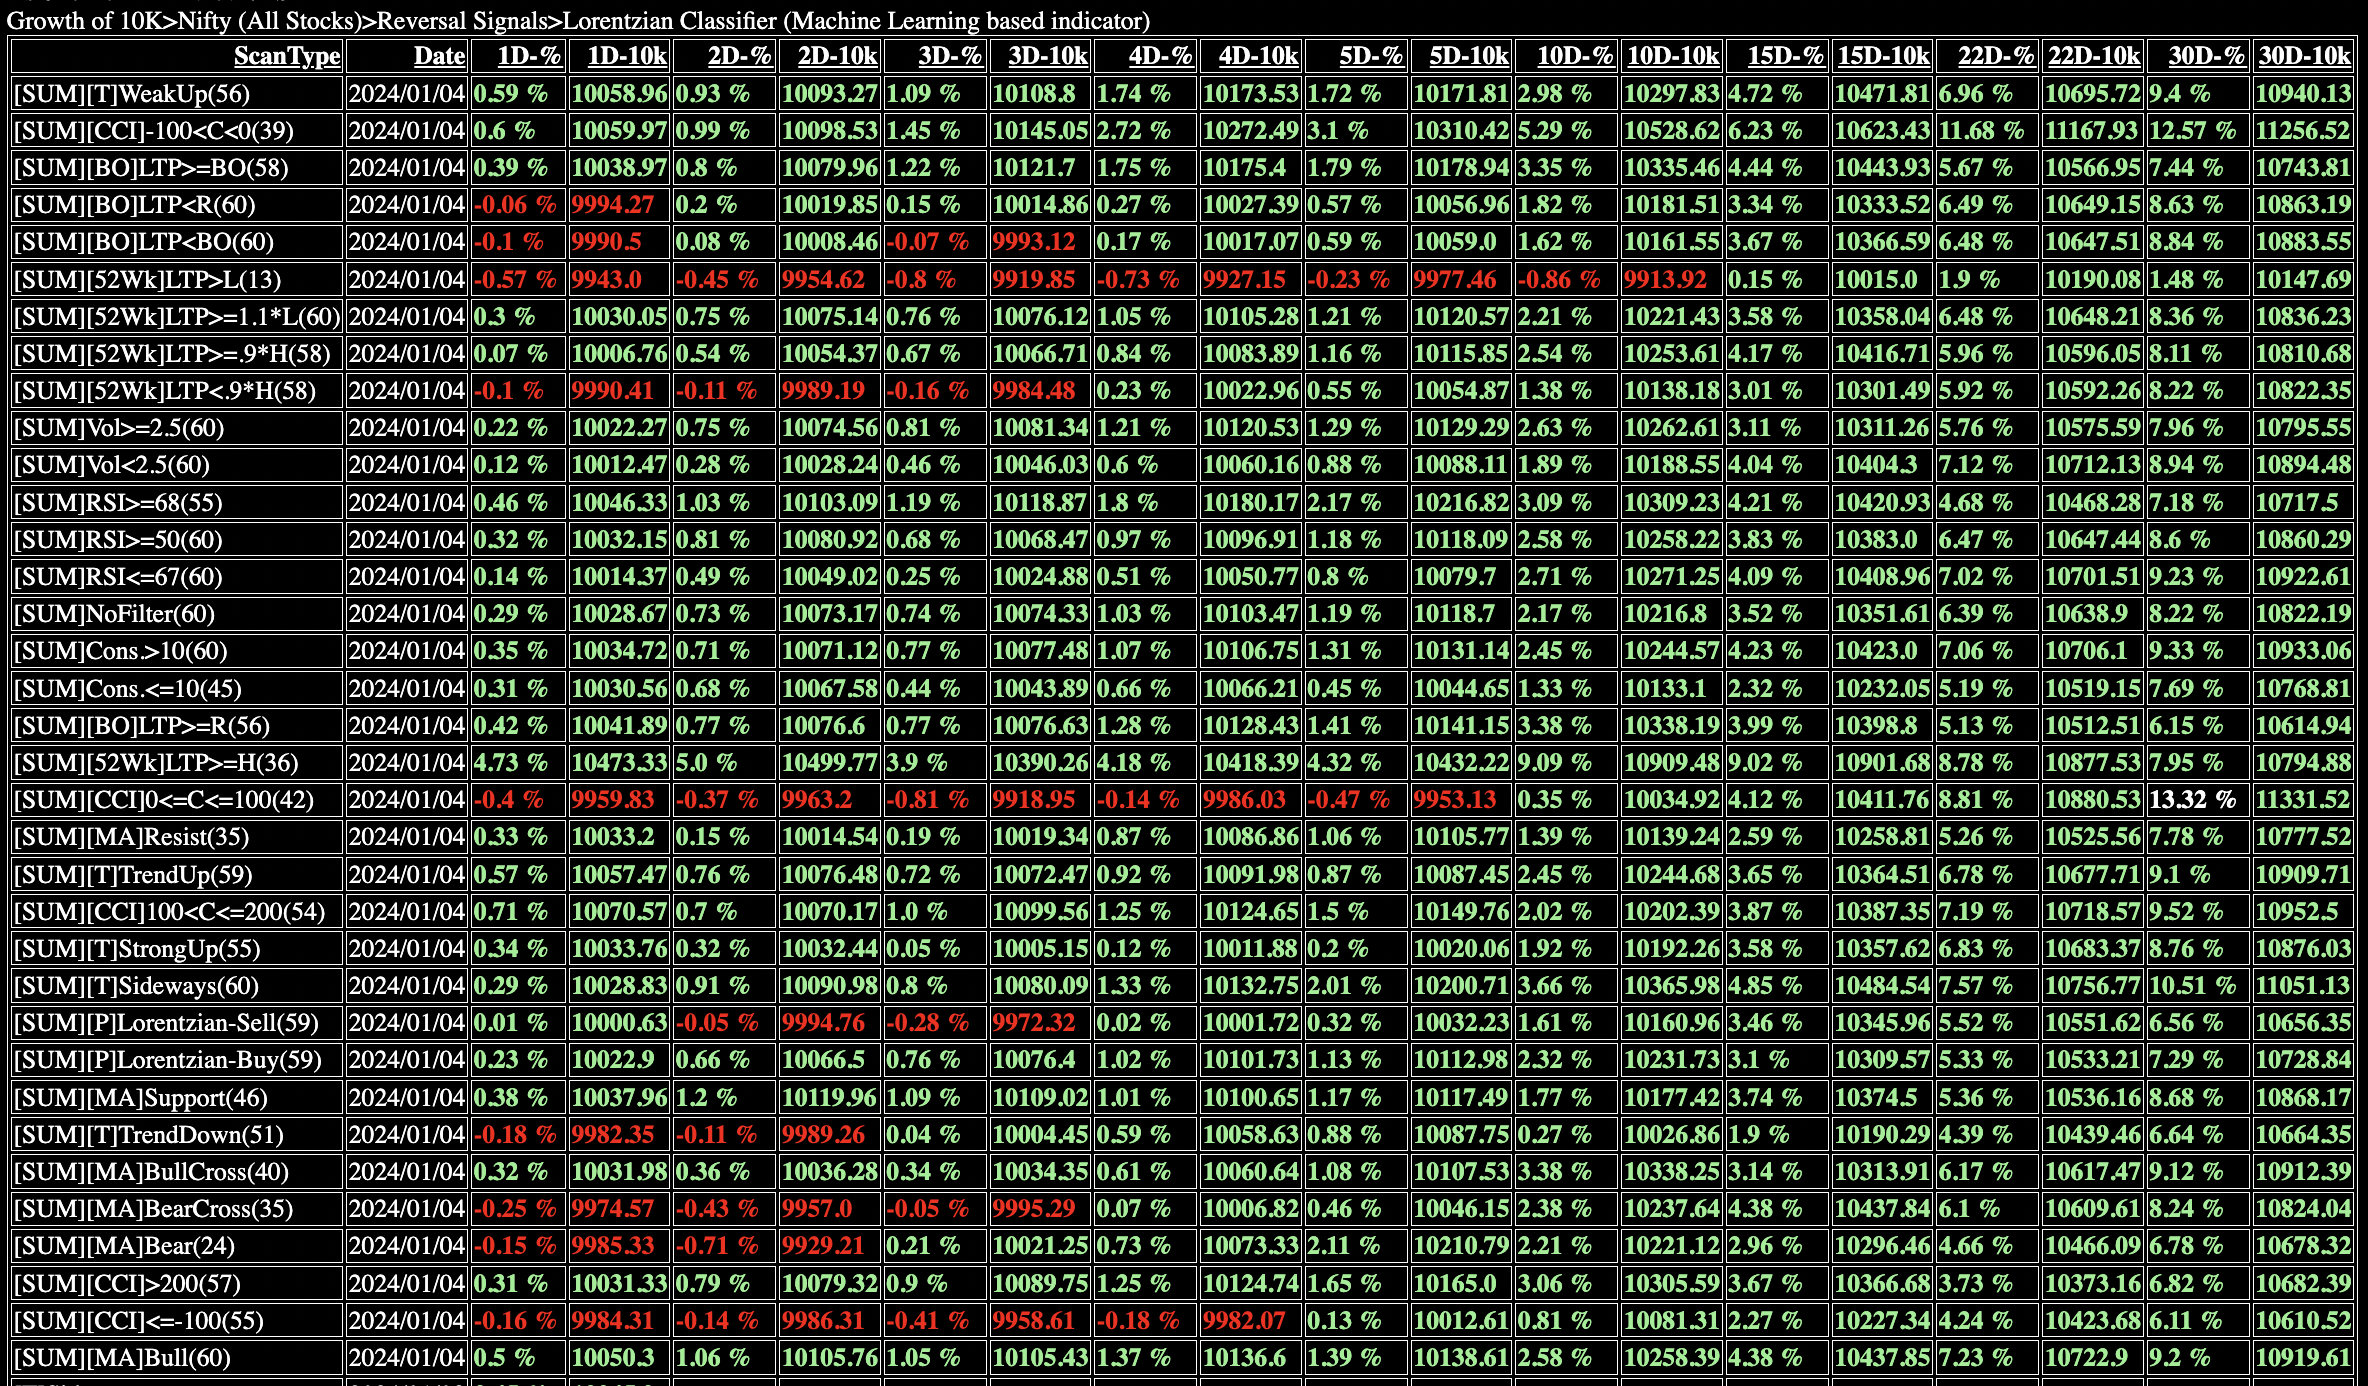
Growth of 10k
You can see the performance of your stocks and/or at portfolio level using "Growth of 10k".
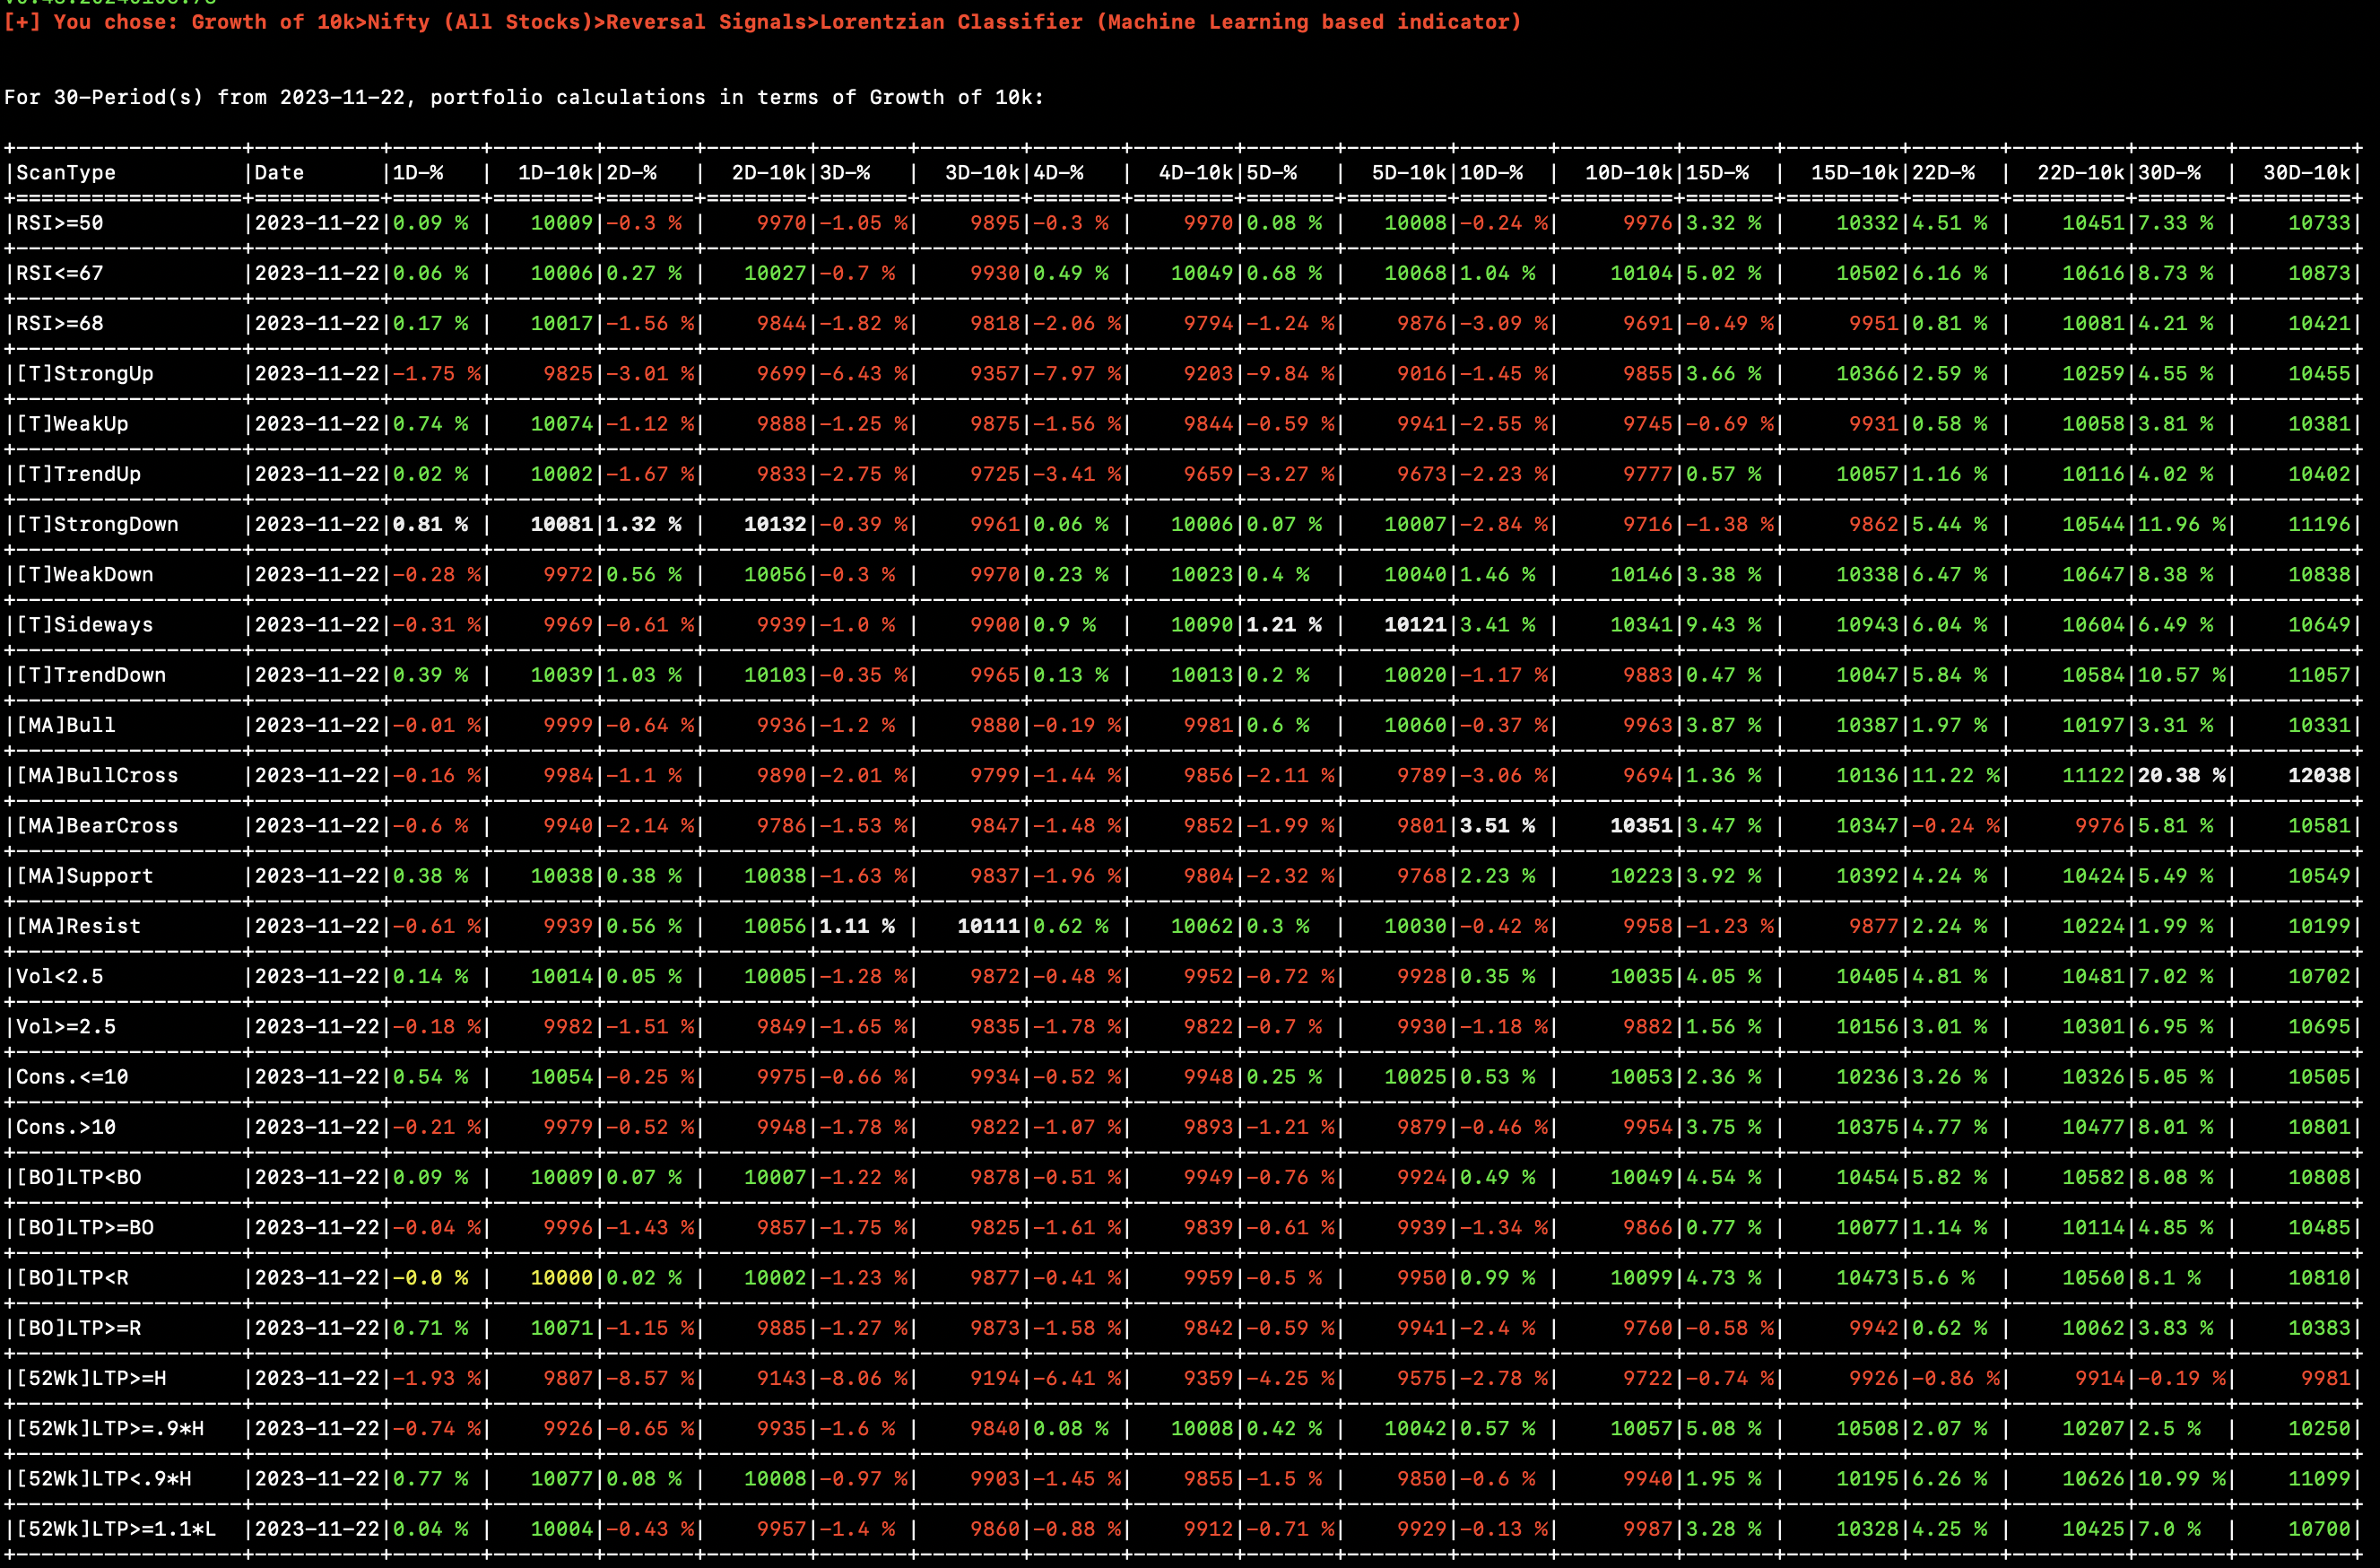
It also summarises the Growth of 10k at portfolio level for the last quarter so that you know which filters worked best in the past:
Backtests
You can now use the Backtests menu to backtest any of the selected strategies. See https://pkjmesra.github.io/PKScreener/BacktestReports.html
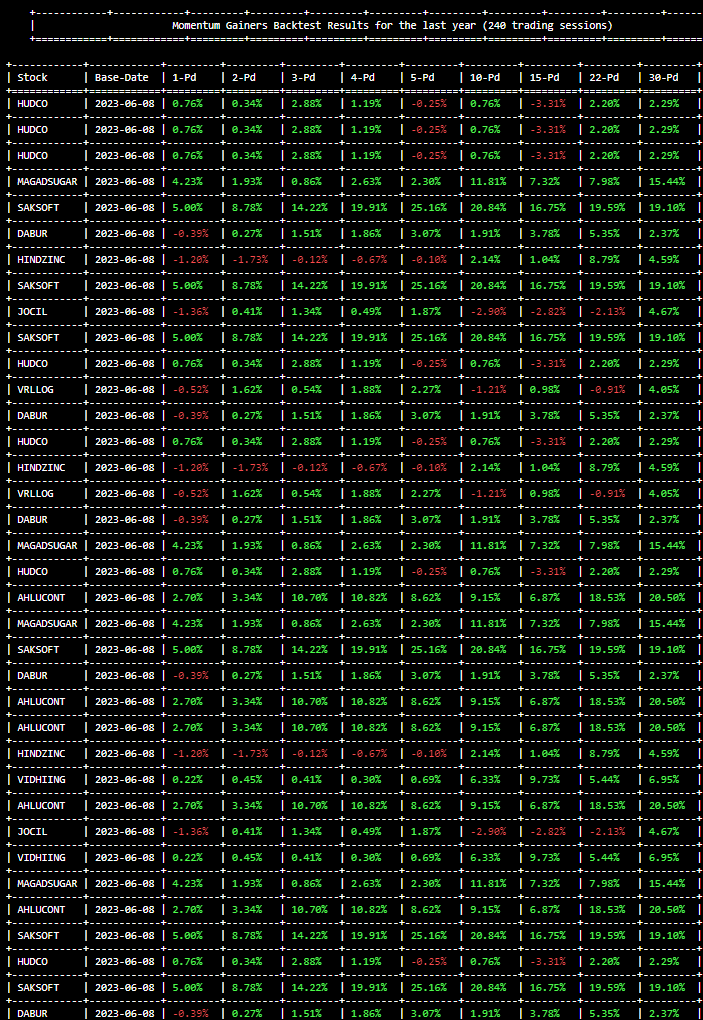
- Once done, you can also view the output html file saved at the same location from where you launched the app.
Scanning as a scheduled job once or at regular intervals
-
Running it once with pre-defined inputs You can also run it as a one time job in any scheduler with pre-defined options. For example
./pkscreenercli.py -a Y -o X:12:10 -e(orpkscreenercli.exe -a Y -o X:12:10 -eif you're executing with the exe) will run the scanner for all Nifty stocks and find all stocks matching CCI filter, save the results in xlsx file and exit../pkscreenercli.py -a Y -o X:12:9:2.5 -ewill run the scanner (menu optionX) for all Nifty stocks (menu option12) to find volume gainers (menu option9) with at least the volume multiplier of 2.5 (input variable2.5), save the results in xlsx file and exit (menu option-e). Passing in the-poption for examplepkscreenercli.py -a Y -p -o X:12:6:1 -ewill also silence all command line prints/outputs and just run silently for the given options, save results and exit. Try and see all options with./pkscreenercli.py -h. -
Running it at regular intervals If you want to runn it at regular intervals, you can just pass the interval in
-ccommand line option. For example,./pkscreenercli.py -a Y -o X:12:6:1 -c 180will run it every180seconds with console outputs also being printed. If you'd just like it to run as a cron job without console outputs, you may also pass the-pparameter. For example,./pkscreenercli.py -a Y -p -o X:12:6:1 -c 180
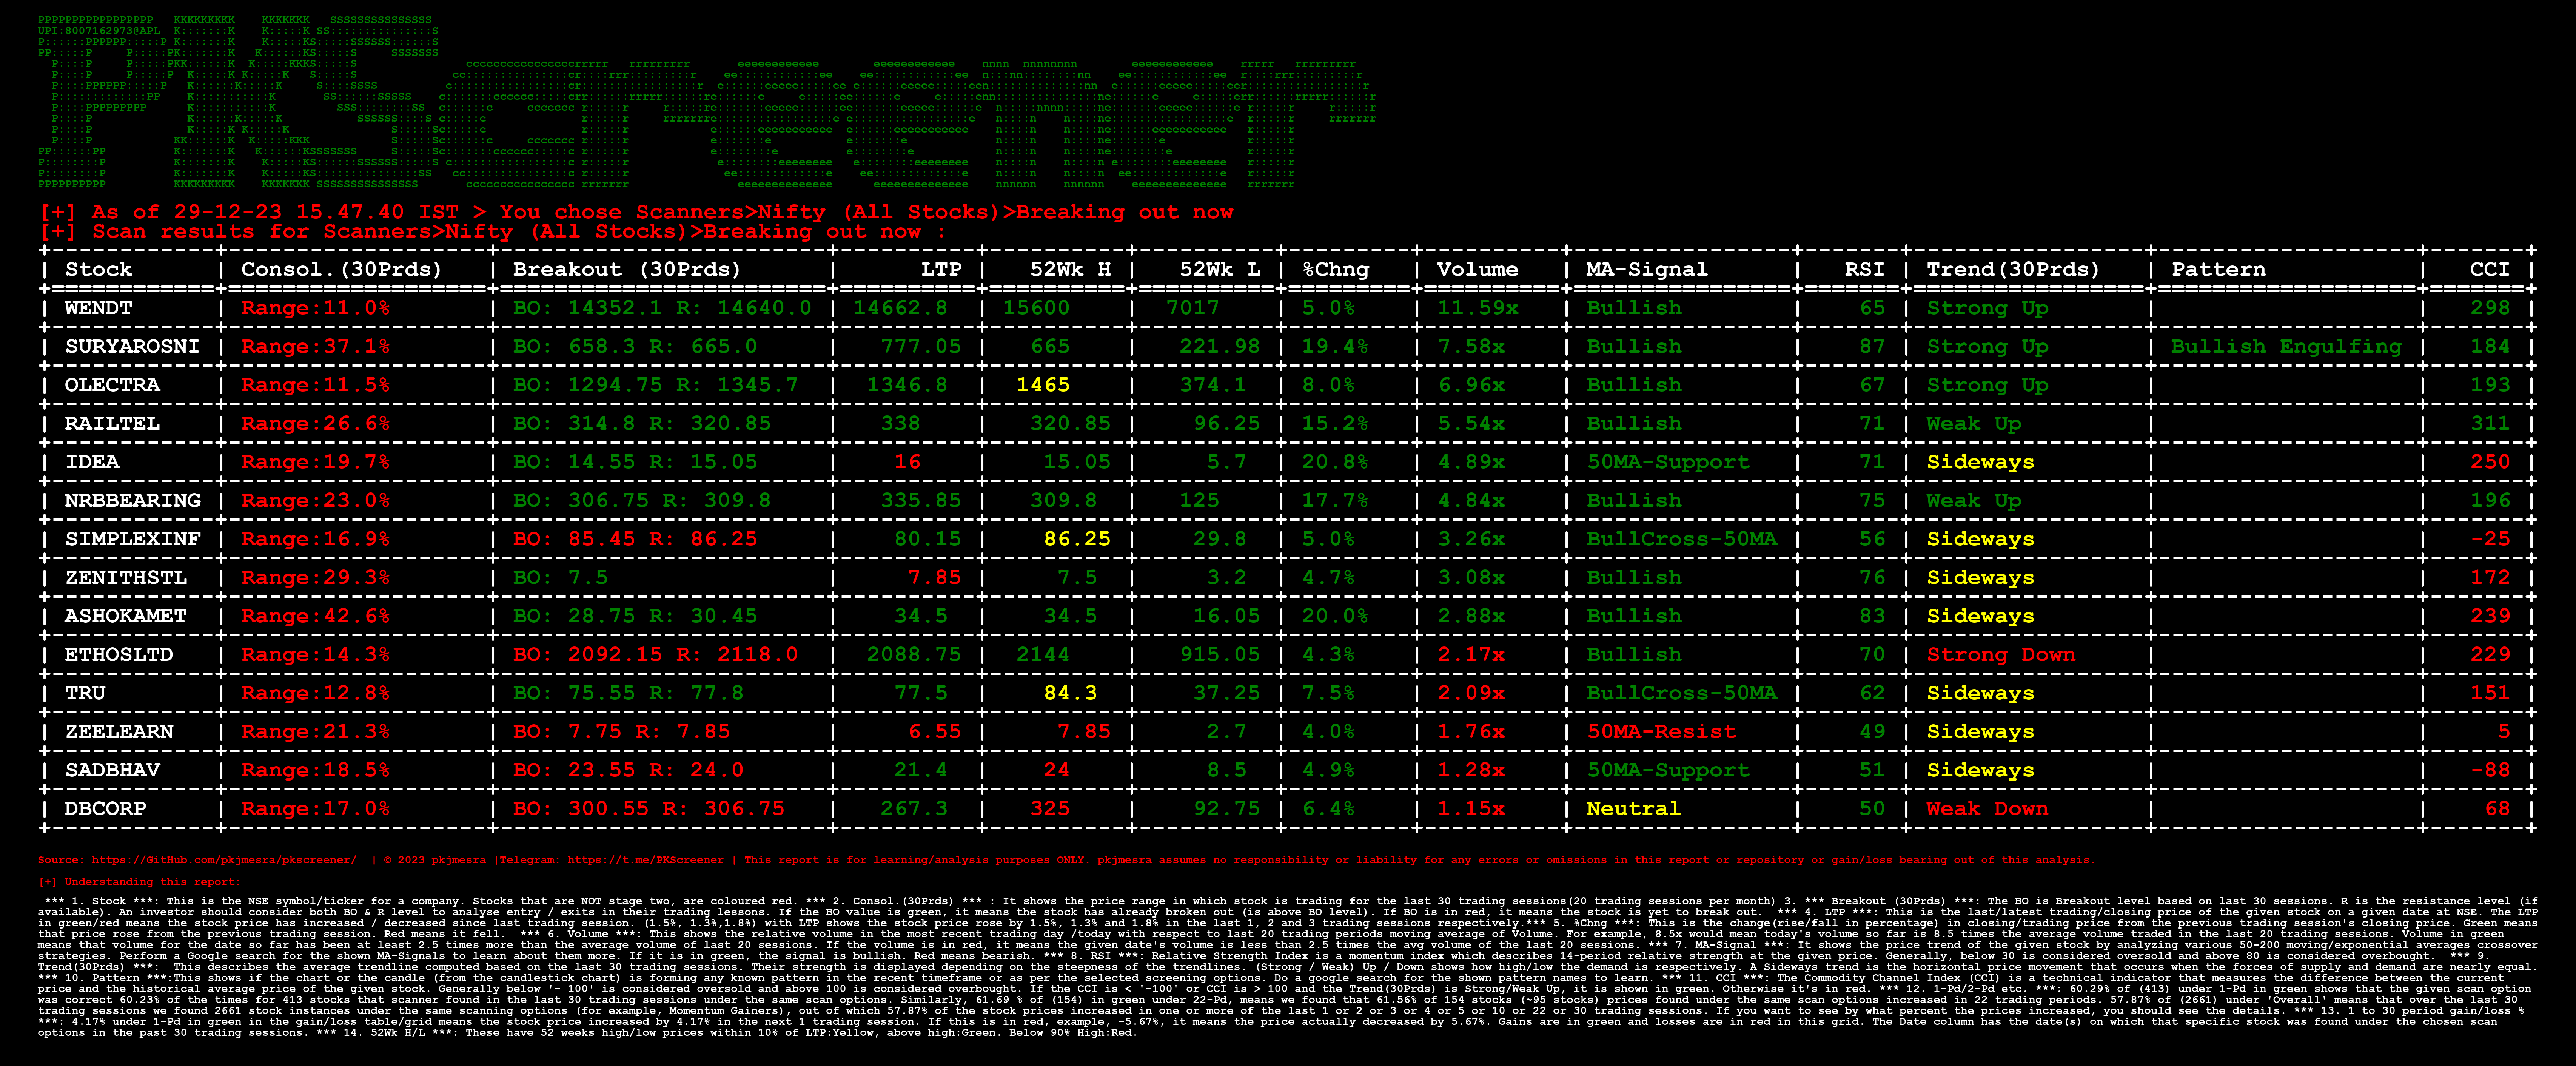
Understanding the Result Table:
The Result table contains a lot of different parameters which can be pretty overwhelming to the new users, so here's the description and significance of each parameter.
| Sr | Parameter | Description | Example |
|---|---|---|---|
| 1 | Stock | This is a NSE scrip symbol. If your OS/Terminal supports unicode, You can directly open TradingView charts by pressing Ctrl+Click on the stock name. |
TATAMOTORS |
| 2 | Consolidating | It gives the price range in which stock is trading since last N days. N is configurable and can be modified by executing Edit User Configuration option. |
If stock is trading between price 100-120 in last 30 days, Output will be Range:20.0 % |
| 3 | Breakout (N Days) | This is pure magic! The BO is Breakout level in last N days while R is the next resistance level if available. Investor should consider both BO & R level to decide entry/exits in their trades. |
B:302, R:313(Breakout level is 100 & Next resistance is 102) |
| 4 | LTP | LTP is the Last Traded Price of an asset traded on NSE. | 298.7 (Stock is trading at this price) |
| 5 | Volume | Volume shows the relative volume of the recent candle with respect to 20 period MA of Volume. It could be Unknown for newly listed stocks. |
if 20MA(Volume) is 1M and todays Volume is 2.8M, then Volume = 2.8x |
| 6 | MA-Signal | It describes the price trend of an asset by analysing various 50-200 MA/EMA crossover strategies. | 200MA-Support,BullCross-50MA etc |
| 7 | RSI | For the momentum traders, it describes 14-period RSI for quick decision making about their trading plans | 0 to 100 |
| 8 | Trend | By using advance algorithms, the average trendlines are computed for N days and their strenght is displayed depending on steepness of trendlines. (This does NOT show any trendline on chart, it is calculated internally) |
Strong Up, Weak Down etc. |
| 9 | Pattern | If the chart or the candle itself forming any important pattern in the recent timeframe or as per the selected screening option, various important patterns will be indicated here. | Momentum Gainer, Inside Bar (N),Bullish Engulfing etc. |
Hack it your way:
Feel free to Edit the parameters in the pkscreener.ini file which will be generated by the application.
[config]
period = 1y
daystolookback = 22
duration = 1d
minprice = 20.0
maxprice = 50000.0
volumeratio = 2.5
consolidationpercentage = 10.0
shuffle = y
cachestockdata = y
onlystagetwostocks = y
useema = n
showunknowntrends = y
logsenabled = n
generaltimeout = 2.0
longtimeout = 4.0
maxnetworkretrycount = 10
backtestperiod = 60
minimumvolume = 10000
Try to tweak this parameters as per your trading styles. For example, If you're comfortable with weekly charts, make duration=5d and so on. For intraday, you can set period=1d and duration=5m if you would like to calculate with 5minute candles. Set the duration to 15m or whatever value you desire, but keep the period to 1d. This tool, however, works best for short/mid term instead of intraday, but some scans like momentum/volume/NR4 etc can be used for screening stocks for intraday as well. You can use the toggle menu option T to toggle between long term and intraday config before you begin the scanners.
Creating your own Telegram channel to receive your own alerts:
You can create your own telegram channel to receive alerts wherenevr you run it locally on your laptop either from a command line interface console or run it as a scheduler. Simply, go ahead and
- Create a bot for yourself, then a channel and get their IDs. Follow the steps in https://medium.com/codex/using-python-to-send-telegram-messages-in-3-simple-steps-419a8b5e5e2 and https://www.siteguarding.com/en/how-to-get-telegram-bot-api-token
- After you have created the bot using
botFatherand have received/verified your bot id/token and channel ID usingget id bot, simply go topkscreenerfolder in the source code directory and create a.env.devfile with the following (If you are instead using the .exe or .bin or .run file from release, just create this file in the same folder where the executable (.exe or .bin or .run) is placed.)CHAT_ID=Your_Channel_Id_Here_Without_A_Hyphen_or_Minus_Sign TOKEN=Your_Bot_Token_Here chat_idADMIN=Your_Own_ID_Here - From now on, you will begin to receive your own alerts on your telegram channel.
Troubleshooting and Logs:
If you are having issues running the program, you can just launch a command line interface (On windows> Start > Run > cmd) and then launch PKScreener with a command line option of -l. For example, python pkscreenercli.py -l. This will show you the path where the program will save all the log outputs from this run. Copy that path and go ahead and run the application. Altenatively, you can just go ahead and modify the logsEnabled value to y, save & close it and then run python pkscreenercli.py.
After you have finished the run, go to that copied path, zip the contents of the file pkscreener-logs.txt and create an issue at https://github.com/pkjmesra/PKScreener/issues. Please do not forget to attach the log files in the issue.
Contributing:
- Please feel free to Suggest improvements bugs by creating an issue.
- Please follow the Guidelines for Contributing while making a Pull Request.
Disclaimer:
- DO NOT use the results provided by the software 'solely' to make your trading decisions.
- Always backtest and analyze the stocks manually before you trade.
- The Author(s), the software and any related/unrelated entity will not be held liable for your own investing decisions or losses. The authors or this softfware does not make any claim about the correctness of the results.
- This screener began as a [fork] but has since added a lot of additional scanners, backtesting, Telegram bots, Alerts and a number of modifications and improvements.