QuestDB data source for Grafana

The QuestDB data source plugin allows you to query and visualize QuestDB data from within Grafana.
Installation
For detailed instructions on how to install the plugin on Grafana Cloud or locally, please check out the Plugin installation docs.
Read the guide on QuestDB website: Third-party Tools - Grafana.
Configuration
QuestDB user for the data source
Set up an QuestDB user account with readonly permission and access to
databases and tables you want to query. Please note that Grafana does not
validate that queries are safe. Queries can contain any SQL statement. For
example, statements like UPDATE users SET name='blahblah'
and DROP TABLE importantTable; would be executed.
To configure a readonly user, follow these steps:
- Open Source version
- Set the following properties in server.conf file:
- pg.readonly.user.enabled=true
- pg.readonly.user=myuser
- pg.readonly.password=secret
- Restart QuestDB instance.
- Set the following properties in server.conf file:
- Enterprise version
- Create user:
- CREATE USER grafana_readonly;
- Grant read permission on selected tables/table columns ;
- GRANT SELECT ON table1, ... TO grafana_readonly;
- Create user:
Manual configuration
Once the plugin is installed on your Grafana instance, follow these instructions to add a new QuestDB data source, and enter configuration options.
With a configuration file
It is possible to configure data sources using configuration files with Grafana’s provisioning system. To read about how it works, including all the settings that you can set for this data source, refer to Provisioning Grafana data sources.
Note that the plugin must be previously installed. If you are using Docker and want to automate installation, you can set the GF_INSTALL_PLUGINS environment variable
docker run -p 3000:3000 -e GF_INSTALL_PLUGINS=questdb-questdb-datasource grafana/grafana-ossThis is an example provisioning file for this data source using the default configuration for QuestDB Open Source.
apiVersion: 1
datasources:
  - name: QuestDB
    type: questdb-questdb-datasource
    jsonData:
      server: localhost
      port: 8812
      username: admin
      tlsMode: disable
      # timeout: <seconds>
      # queryTimeout: <seconds>
      maxOpenConnections: 100
      maxIdleConnections: 100
      maxConnectionLifetime: 14400
    secureJsonData:
      password: quest
      # tlsCACert: <string>
If you are using QuestDB Enterprise and have enabled TLS, you would need to change
tlsMode: require in the example above.
Building queries
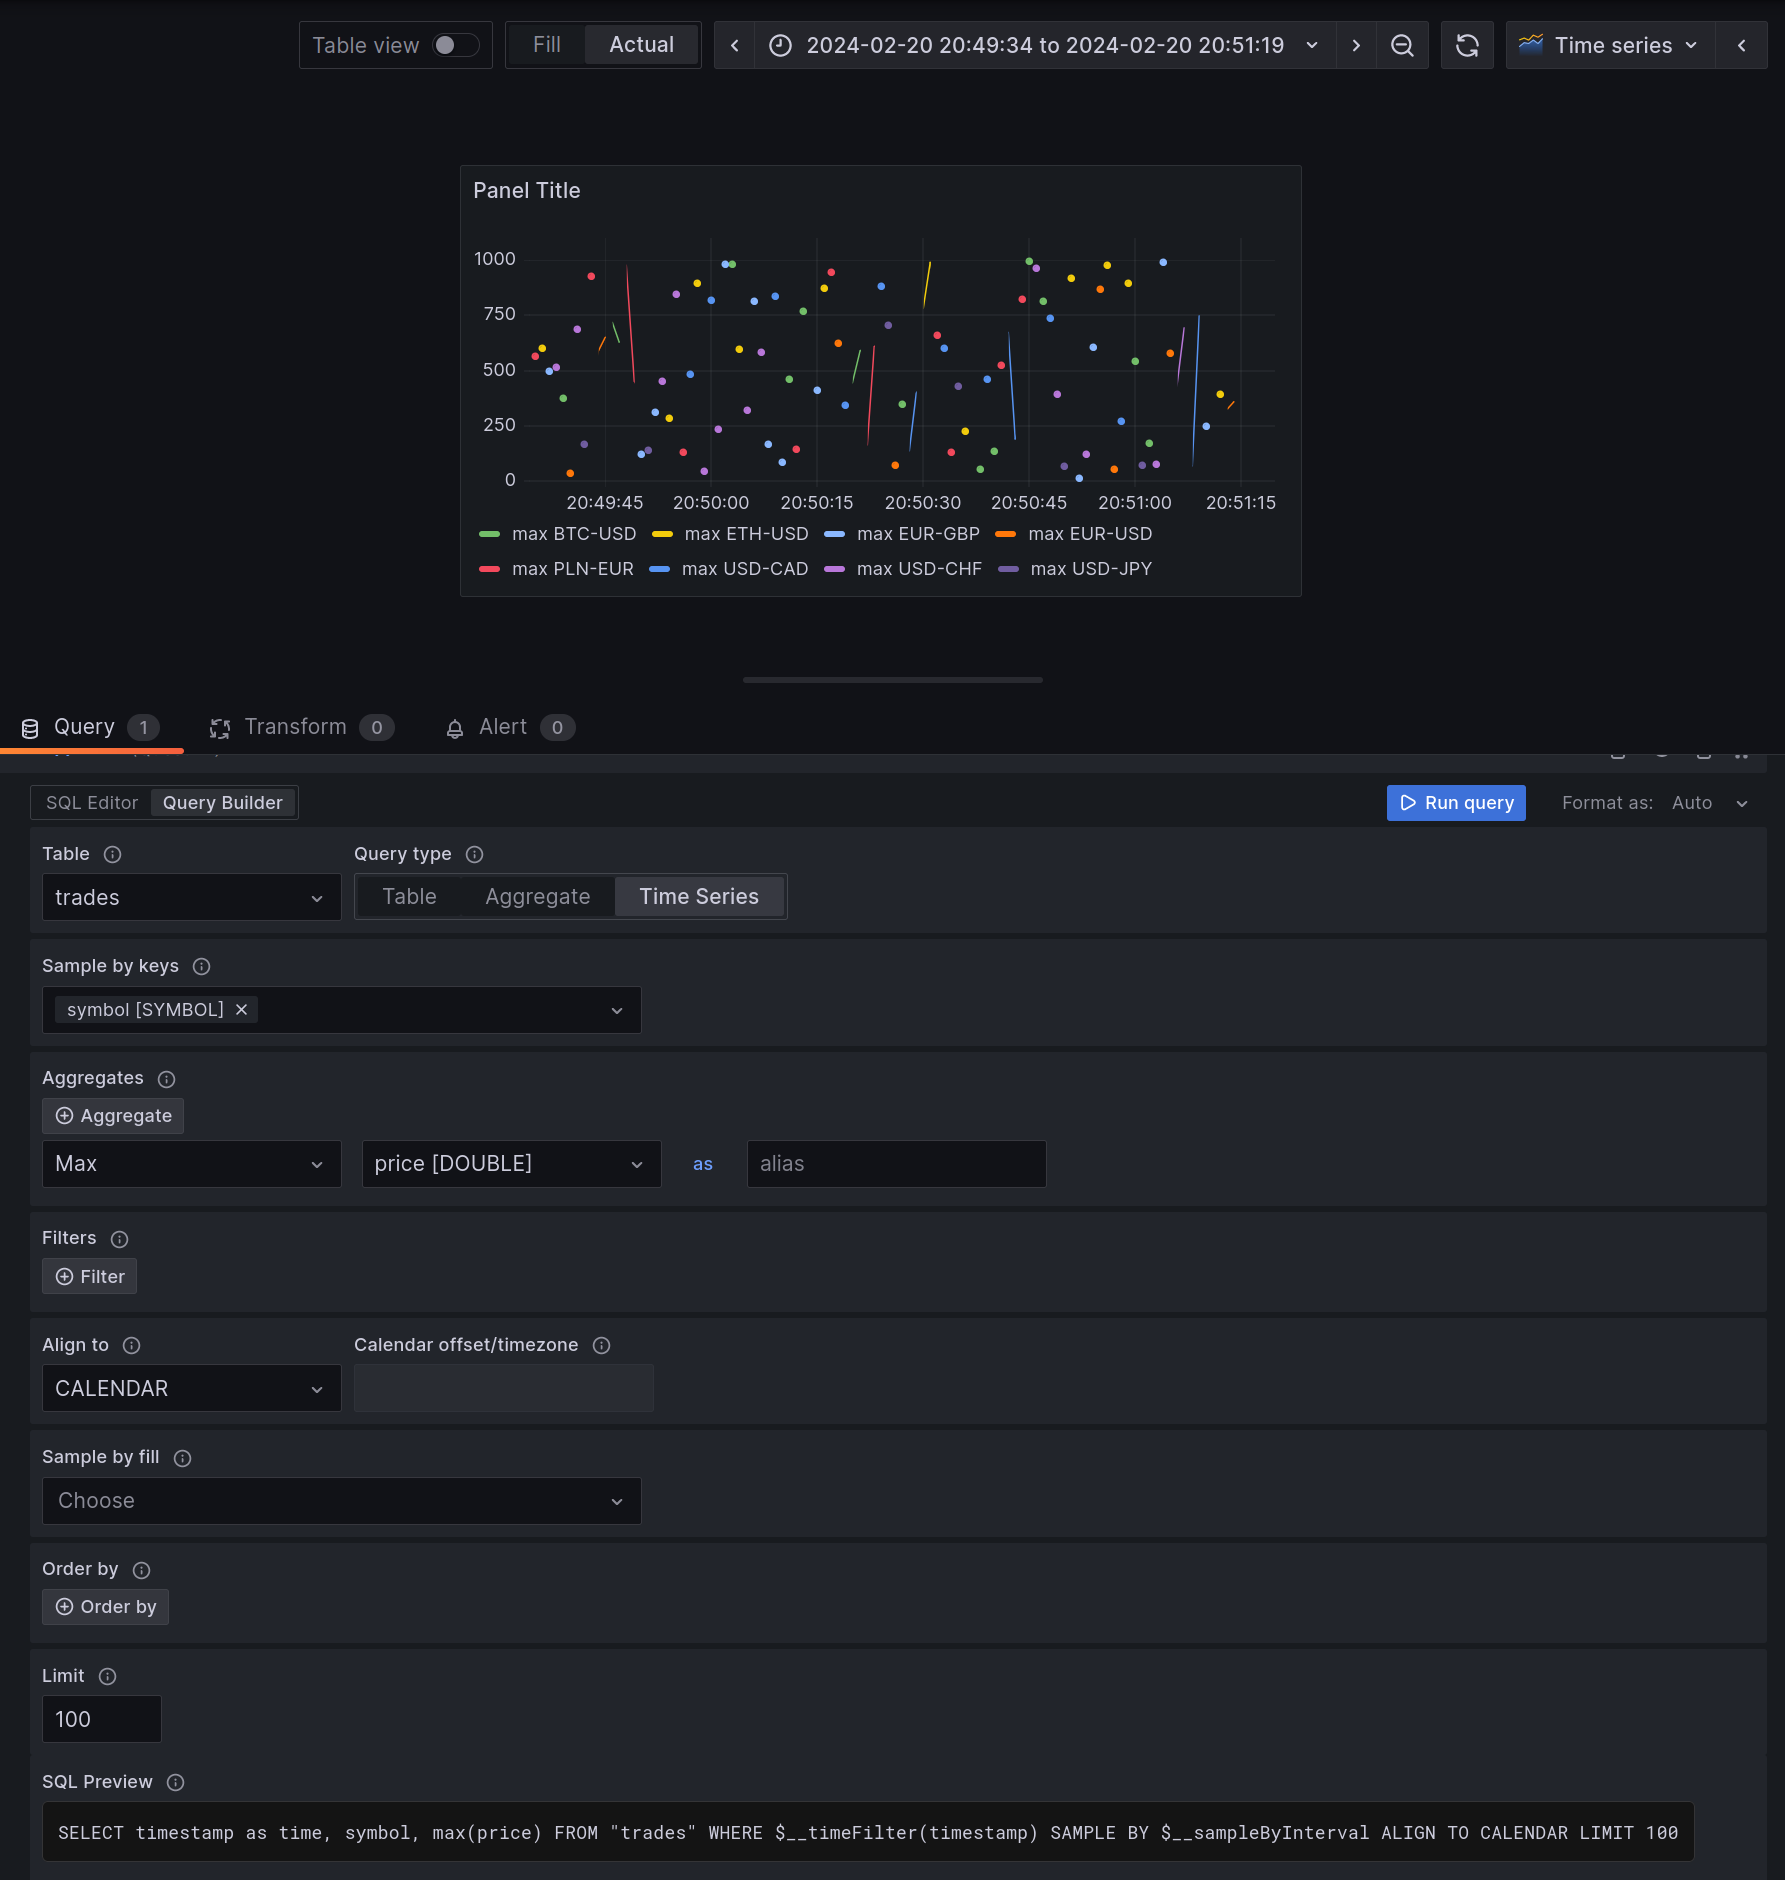
The query editor allows you to query QuestDB to return time series or tabular data. Queries can contain macros which simplify syntax and allow for dynamic parts.
Time series
Time series visualization options are selectable after adding a timestamp
field type to your query. This field will be used as the timestamp. You can
select time series visualizations using the visualization options. Grafana
interprets timestamp rows without explicit time zone as UTC. Any column except
time is treated as a value column.
Multi-line time series
To create multi-line time series, the query must return at least 3 fields in the following order:
- field 1:
timestampfield with an alias oftime - field 2: value to group by
- field 3+: the metric values
For example:
SELECT pickup_datetime AS time, cab_type, avg(fare_amount) AS avg_fare_amount
FROM trips
GROUP BY cab_type, pickup_datetime
ORDER BY pickup_datetime
Tables
Table visualizations will always be available for any valid QuestDB query.
Macros
To simplify syntax and to allow for dynamic parts, like date range filters, the query can contain macros.
Here is an example of a query with a macro that will use Grafana's time filter:
SELECT desginated_timestamp, data_stuff
FROM test_data
WHERE $__timeFilter(desginated_timestamp)| Macro | Description | Output example |
|---|---|---|
| $__timeFilter(columnName) | Replaced by a conditional that filters the data (using the provided column) based on the time range of the panel in seconds | timestamp >= cast(1706263425598000 as timestamp) AND timestamp <= cast(1706285057560000 as timestamp) |
| $__fromTime | Replaced by the starting time of the range of the panel cast to timestamp | cast(1706263425598000 as timestamp) |
| $__toTime | Replaced by the ending time of the range of the panel cast to timestamp | cast(1706285057560000 as timestamp) |
| $__sampleByInterval | Replaced by the interval followed by unit: d, h, s or T (millisecond). Example: 1d, 5h, 20s, 1T. | 20s (20 seconds) , 1T (1 millisecond) |
| $__conditionalAll(condition, $templateVar) | Replaced by the first parameter when the template variable in the second parameter does not select every value. Replaced by the 1=1 when the template variable selects every value. | condition or 1=1 |
The plugin also supports notation using braces {}. Use this notation when queries are needed inside parameters.
Additionally, Grafana has the built-in [$__interval macro][query-transform-data-query-options], which calculates an interval in seconds or milliseconds.
It shouldn't be used with SAMPLE BY because of time unit incompatibility, 1ms vs 1T (expected by QuestDB). Use $__sampleByInterval instead.
Templates and variables
To add a new QuestDB query variable, refer to Add a query variable.
After creating a variable, you can use it in your QuestDB queries by using Variable syntax. For more information about variables, refer to Templates and variables.
Ad Hoc Filters
Ad hoc filters allow you to add key/value filters that are automatically added to all metric queries that use the specified data source, without being explicitly used in queries.
By default, Ad Hoc filters will be populated with all Tables and Columns. If
you have a default database defined in the Datasource settings, all Tables from
that database will be used to populate the filters. As this could be
slow/expensive, you can introduce a second variable to allow limiting the
Ad Hoc filters. It should be a constant type named questdb_adhoc_query
and can contain: a comma delimited list of tables to show only columns for one or more tables.
For more information on Ad Hoc filters, check the Grafana docs
Using a query for Ad Hoc filters
The constant questdb_adhoc_query also allows any valid QuestDB query. The
query results will be used to populate your ad-hoc filter's selectable filters.
You may choose to hide this variable from view as it serves no further purpose.
Learn more
- Add Annotations.
- Configure and use Templates and variables.
- Add Transformations.
- Set up alerting; refer to Alerts overview.
- Read the Plugin guide on QuestDB website