GeoStat
Version 2.3
GeoStat a Python-based script for parsing Nginx and Apache log files and getting GEO data about incoming IPs from them. This script converts parsed data into JSON format and sends it to the InfluxDB database, so you can use it for building nice Grafana dashboards. Now, this program supports old InfluxDB 1.8 and modern InfluxDB 2. The application runs as SystemD service and parses log files in "tailf" style. Also, you can run it as a Docker container if you wish.
New in version 2.3
- Was added the InfluxDB 2 support, now you can use not only old InfluxDB 1.8 but also send data into modern InfluxDB 2.*
- Was fixed small bugs also.
New in version 2.2
-
The application was rewritten with adding the availability of parsing more than one log file at one time, now you can parse multiple separated websites on the host. To do that please set up all virtual hosts or websites to save their log files in different places.
The settings.ini configuration for log files now looks in this way, you need to put the config in that format website.name:/var/log/website_access.log. Different logs must be separated with a space.
The example you can find in settings.ini.back:
[NGINX_LOGS] #Path for the log file (Nginx) logpath = website1:/var/log/website1/access.log website2:/var/log/website2/access.log - Fixed the Docker container issue, that was related to the new Python3 version in Alpine image.
New in version 2.0
- The application was rewritten with python3
- Was added few additional tags to JSON output, the country name, and the city name.
- Was fixed the few bugs with the geohash lib and with the install.sh script.
- Also was added the simple logging feature, now you can catch this application log in the Syslog file.
- The Dockerfile was recreated with the python3 support also.
- Was done all needed tests, and all things looks OK :)
Main Features:
- Parsing incoming IPs from web server log and converts them into GEO metrics for the InfluxDB.
- Using standard python libs for maximum easy use.
- Having an external settings.ini file for comfortable changing parameters.
- Having a Dockerfile inside for quick building Docker image.
- Contains an install.sh script that will do the installation process easy.
- Runs as a SystemD service
JSON format that script sends to InfluxDB looks like:
[
    {
        'fields': {
            'count': 1
        },
        'measurement': 'geo_cube',
        'tags': {
            'host': 'cube'
            'website': 'website.com'
            'geohash': 'u8mb76rpv69r',
            'country_code': 'UA'
            'country_name': 'Ukraine'
            'city_name': 'Odessa'
        }
     }
]
As you can see there are six fields in the JSON output, so you can build dashboards using geo-hash (with a point on the map) or country code, or with the country name and city name. Build dashboards with variables based on the hostname tag or combine them all. A count for any metric equals 1, so it'll be easy summarising. This script doesn't parse the log file from the beginning but parses it line by line after starting. So you can build dashboards using count of data after some time will pass.
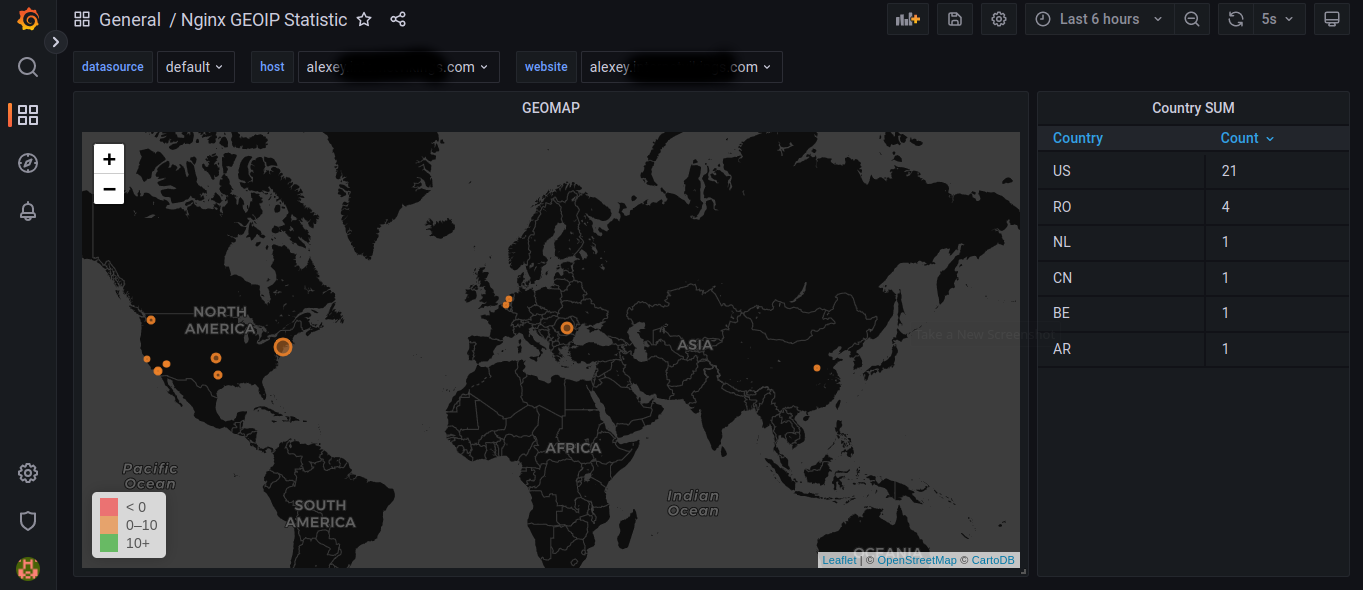
You can find the example of the Grafana dashboard in geomap.json file or take it from the grafana.com: https://grafana.com/dashboards/8342
Tech
GeoStat uses a number of open source libs to work properly:
- Geohash - Python module that provides functions for decoding and encoding Geohashes. Now it was added as local lib, and no longer need to be installed with pip.
- InfluxDB-Python - Python client for InfluxDB.
Important
The GeoLite2-City database no longer available for the simple downloading, now you need register on the maxmind.com website first. After you'll get an account on the maxmind.com you can find the needed file by the link
(https://www.maxmind.com/en/accounts/YOURACCOUNTID/geoip/downloads)
Please don't forget to unzip and put the GeoLite2-City.mmdb file in the same directory with the geoparse.py script, or you can put it anywhere and then fix the path in the settings.ini.
Installation
You can install it in a few ways:
Using install.sh script:
1) Clone the repository.
2) CD into the directory and then run install.sh, it will asks you to set properly settings.ini parameters, like Nginx/Apache access.log path, and InfluxDB settings.
3) After the script will finish the application installationion you need copy the GeoLite2-City.mmdb file into the application local directory and start the SystemD service with systemctl start geostat.service.
Manually: 1) Clone the repository, create an environment and install requirements
$ cd geostat
$ python3 -m venv venv && source venv/bin/activate
$ pip3 install -r requirements.txt
2) Modify settings.ini & geostat.service files and copy service to systemd.
$ cp settings.ini.back settings.ini
$ vi settings.ini
$ cp geostat.service.template geostat.service
$ vi geostat.service
$ cp geostat.service /lib/systemd/system/
3) Register and download latest GeoLite2-City.mmdb file from maxmind.com
$ cp ./any_path/GeoLite2-City.mmdb ./4) Then enable and start service
$ systemctl enable geostat.service
$ systemctl start geostat.service
Using Docker image: 1) Build the docker image using the Dockerfile inside geostat repository directory:
$ docker build -t some-name/geostat .2) Register and download latest GeoLite2-City.mmdb file from maxmind.com
$ cp ./any_path/GeoLite2-City.mmdb ./3) After Docker image will be created you can run it using properly edited settings.ini file and you also, need to forward the Nginx/Apache logfile inside the container:
docker run -d --name geostat -v /opt/geostat/settings.ini:/settings.ini -v /var/log/nginx_access.log:/var/log/nginx_access.log some-name/geostatAfter the first metrics will reach the InfluxDB you can create nice dashboards in Grafana.
Have fun !
License
MIT
Free Software, Hell Yeah!