silx-kit / h5web

React components for data visualization and exploration
https://h5web.panosc.eu/
MIT License
183 stars 18 forks source link

Support auxiliary signals for heatmaps #1500

Closed woutdenolf closed 7 months ago

woutdenolf commented 1 year ago

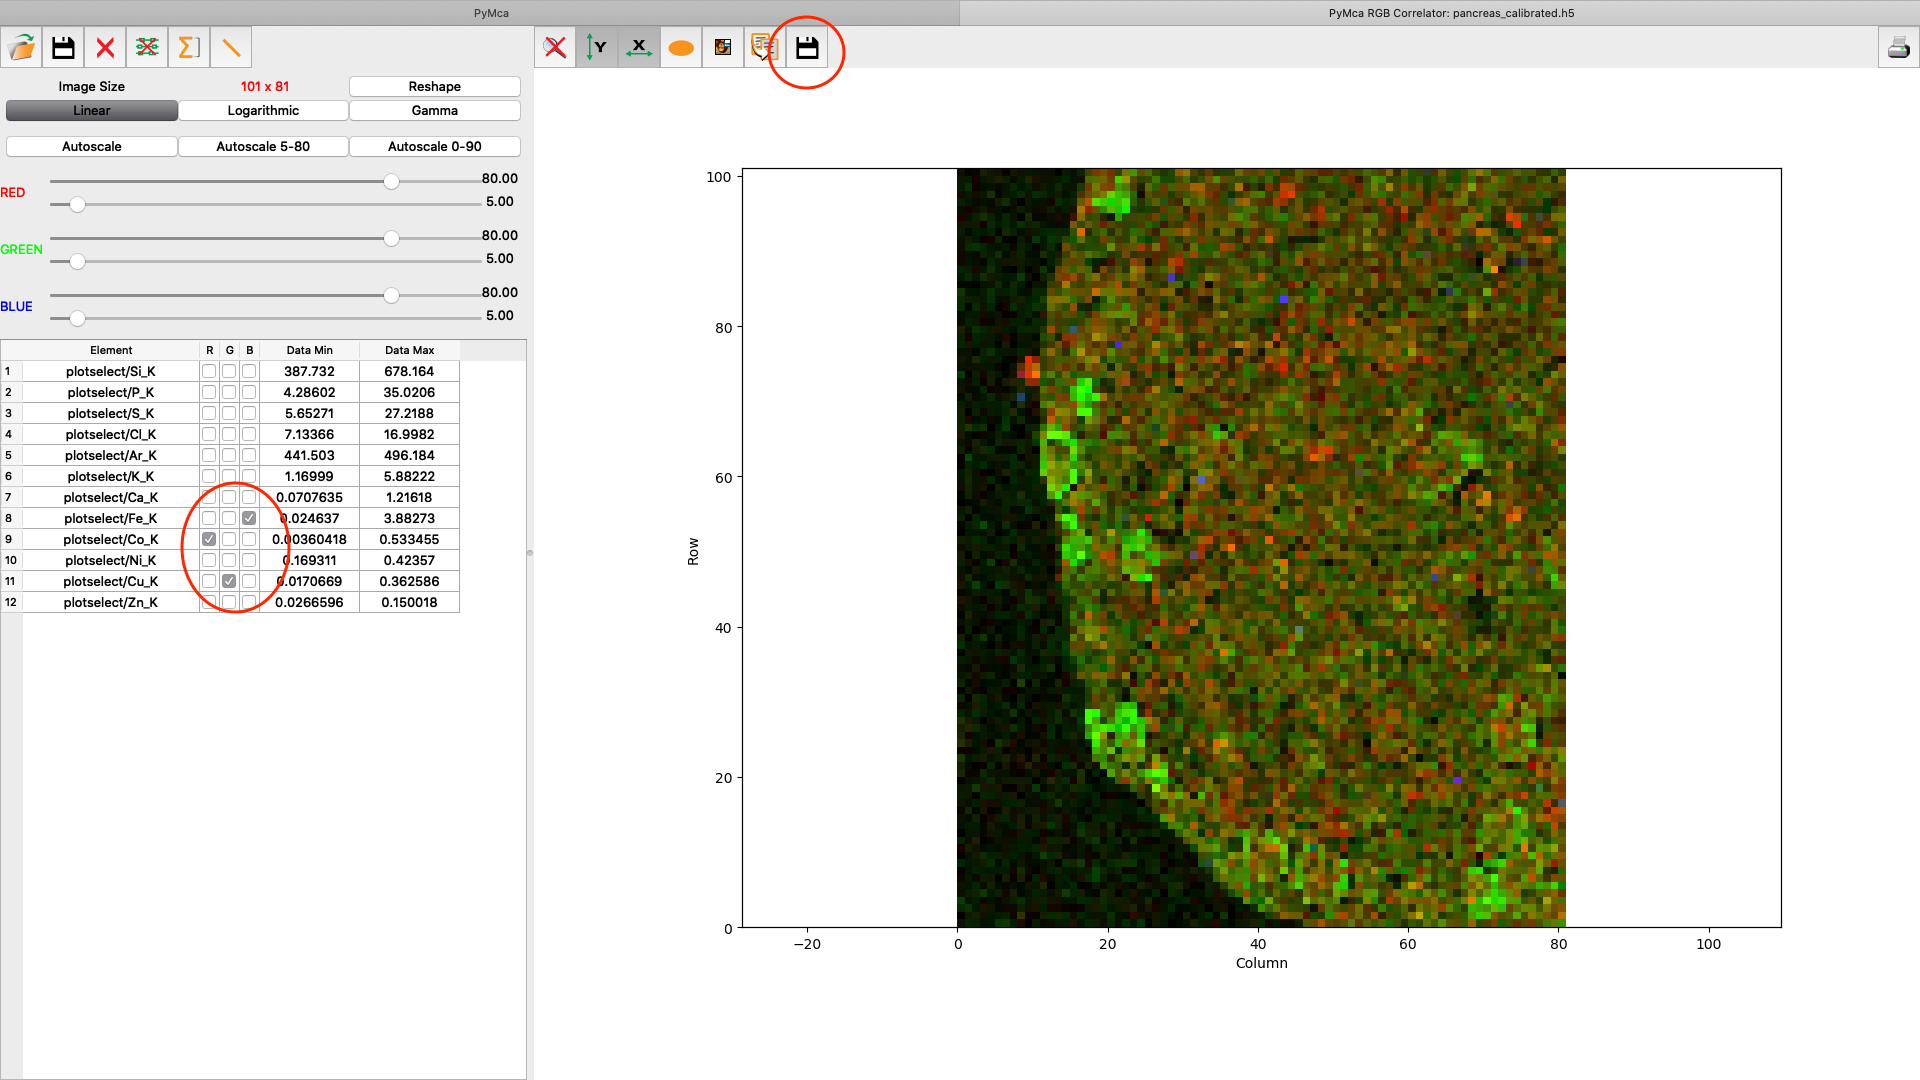
Example: https://h5web.panosc.eu/h5grove?file=wdnexamples/dectris.h5

The line plot supports auxiliary signals (plots them all together with the @signal) while the heatmap does not.

It is enough to select only one signal to plot, the @signal being the default while @auxiliary_signals are the alternatives. For example a dropdown would work.

axelboc commented 7 months ago

Looking into this again, I would like to clarify two aspects of this feature: the domain computation and the tooltip.

Domain computation

In the line visualization, auxiliary signals are included in the domain computation. It makes sense because they are all plotted together and the domain defines the range of the y axis.

Should auxiliary signals be included when computing the domain for the heatmap's color map?

Currently, they are not included, so if we were to implement a signal/auxiliaries selector, the domain would change depending on which signal/auxiliary is selected. By default, auto-scale is enabled, so the color map range would also change as a result.

By including the auxiliary signals in the domain computation, the color map's range would remain stable regardless of auto-scale when interacting with the auxiliaries drop-down This is what the first image in the difference stack would look like by default if that were the case:

image

Tooltip

In the line visualization, the tooltip shows the values of the auxiliary signals:

image

Is this something we want for the heatmap visualization as well?

Assuming we do and that we implement a signal/auxiliaries selector, what happens to the tooltip when an auxiliary signal is selected? Should it show only the selected auxiliary's value? Should it keep showing the values of all the signal/auxiliaries but highlight the one from the selected auxiliary? ...

Tangential question: if the tooltip were to show all the signal/auxiliaries values, would that remove the need for the signal/auxiliaries selector?

woutdenolf commented 7 months ago

My answers are of course biased by the data I'm used to.

For all the use cases I can think of (mostly XRF, XAS, XRPD) I see no reason why we would want to compare signals of the same NXdata group. We care about the variation within each signal independent from the others. This goes for 1D and 2D. I would want a signal selector in 1D and 2D with independent Y and color scaling respectively.

For example think about XRF mapping (2D) or line scans (1D). Each signal is linear proportional to the concentration of a chemical element. Some elements are abundantly present (e.g. mass fraction between 0 and 0.9) and others are not (e.g. mass fraction between 0 and 0.0001). There is no point in comparing those signals on an absolute scale. A 1D plot with all the signals in it will only show the major elements.

The only use case I can think of for plotting multiple signals in the same plot is when comparing the same signal for different scans (i.e. different NXdata groups in different NXentry group). But we can only handle one NXdata group so does not apply.

Should auxiliary signals be included when computing the domain for the heatmap's color map?

No. We don't want to compare signals. We want to visualize the variation within each signal independently.

We do sometimes make RGB images where R, G and B are different signals. But even in that case, the intensity scaling of each channel is independent (see https://www.maxiv.lu.se/wp-content/uploads/2022/12/nanomax_pymca_RGB_correlator.png). If there is only one [min,max] to [0,255] mapping, you would only see the major element.

the tooltip shows the values of the auxiliary signals. Is this something we want for the heatmap visualization as well?

No.

Should it show only the selected auxiliary's value?

Indeed.

if the tooltip were to show all the signal/auxiliaries values, would that remove the need for the signal/auxiliaries selector?

No. We care about the variation within a signal, not the comparison between signals.

axelboc commented 7 months ago

Thanks for all the clarifications, @woutdenolf. The solution implemented in #1577, which I hope you'll like, takes the form of radio buttons located above the heatmap (I was not quite happy with the drop-down UI we had initially discussed).