H5Web: React components for data visualization and exploration
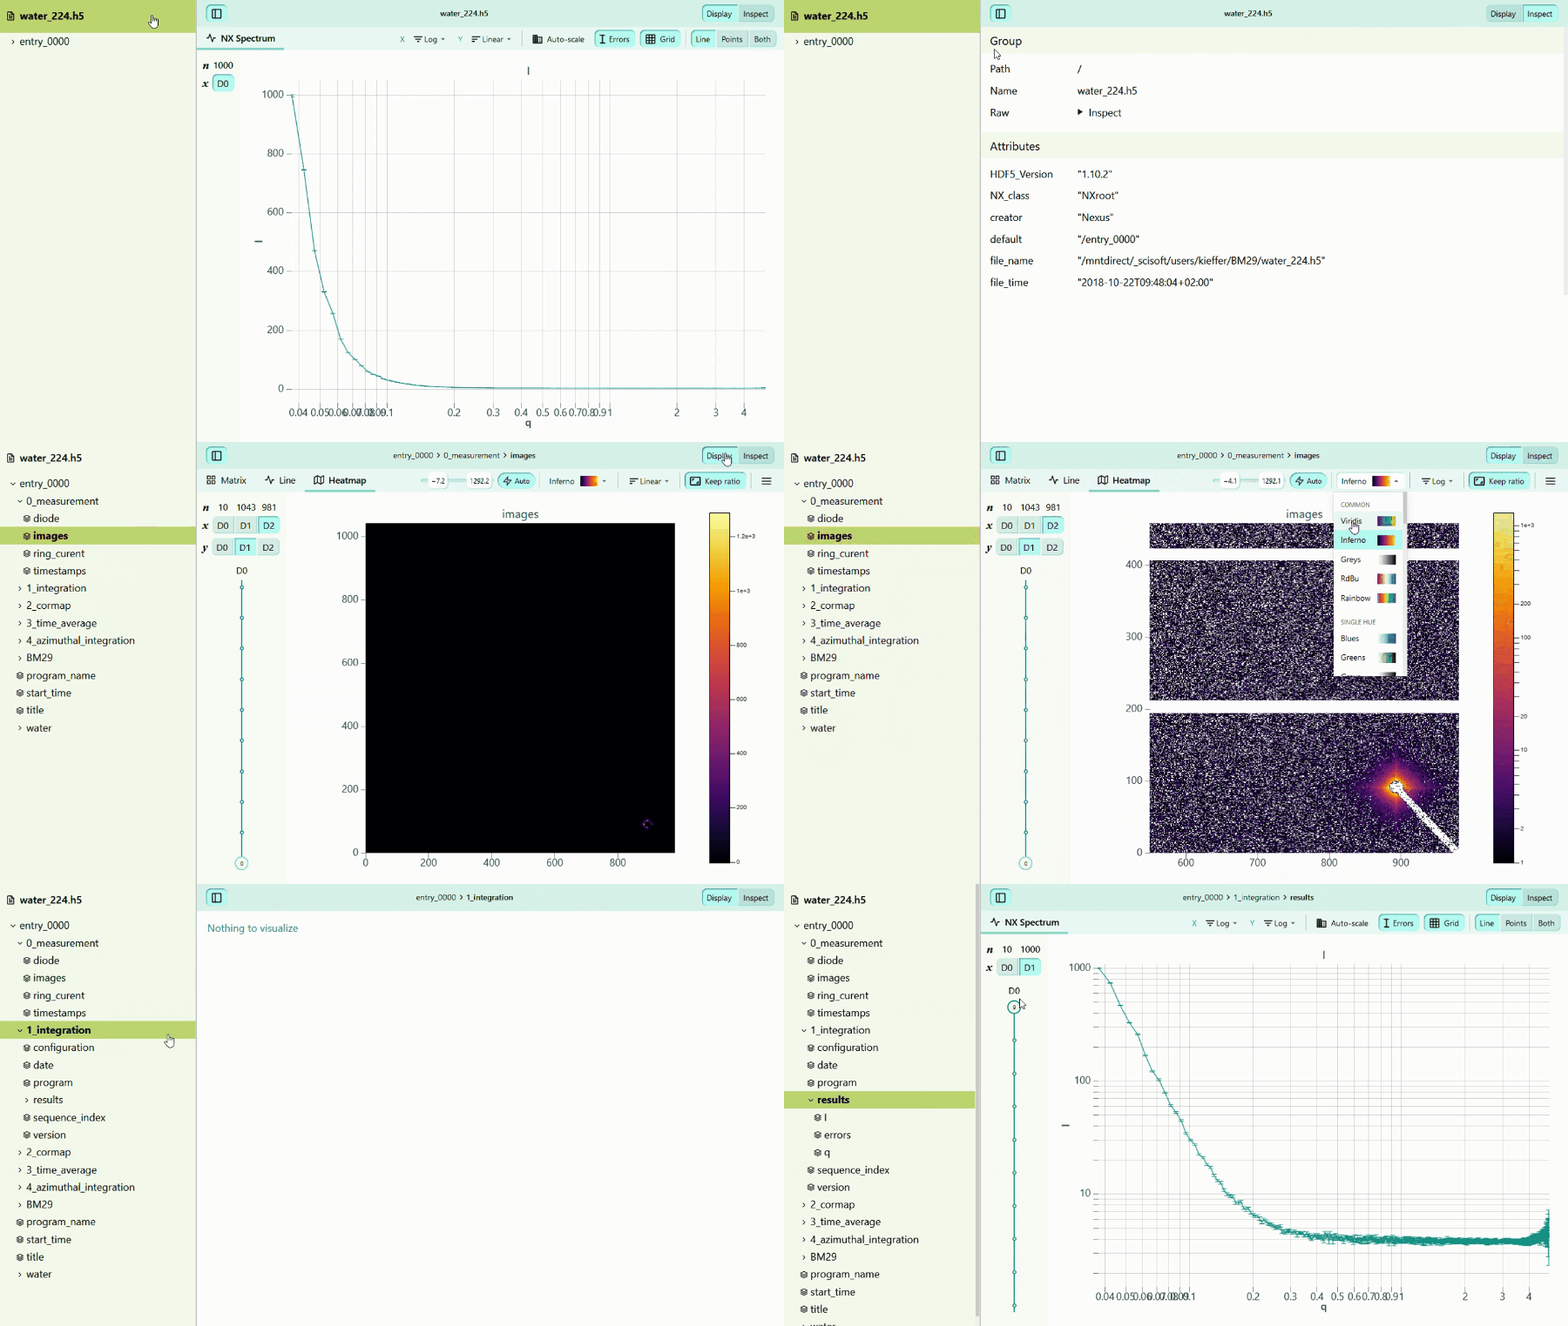
H5Web is a collection of React components to visualize and explore data. It consists of three packages:
- @h5web/lib: visualization components built with react-three-fiber.
- @h5web/app: a component to explore and visualize data stored in HDF5 (or HDF5-like) files, and data providers to connect this component to various back-end solutions.
- @h5web/h5wasm: an additional data provider that can read HDF5 files straight in the browser.
While H5Web was initially built with the HDF5 format in mind,
@h5web/libvisualization components are not tied to HDF5 and can be used to visualize data from any source. Also,@h5web/applets you write your own data provider and can therefore work with any other hierarchical data format.
If you're after a ready-made solution to view local HDF5 files, take a look at myHDF5, at the Visual Studio Code extension or at the JupyterLab extension.

NPM packages 📚
@h5web/lib
H5Web's component library, which includes the main visualization components
(LineVis, HeatmapVis, etc.) as well as some of their lower-level building
blocks (VisCanvas, ColorBar, etc.)
The library is documented in a Storybook site accessible at https://h5web-docs.panosc.eu.
Some examples of usage of @h5web/lib:
| Multiple curves | Heatmap with color bar | Gamma vs Power scale |
|---|---|---|
@h5web/app
HDF5 viewer component (App) and built-in data providers.
Data providers are components that fetch data from HDF5 back-end solutions and
provide this data to the app through React Context. H5Web currently includes
three providers, two of which are available in the @h5web/app package:
H5GroveProviderfor server implementations based on h5grove, like jupyterlab-h5webHsdsProviderfor HSDS
@h5web/h5wasm
This package includes two additional data providers, H5WasmLocalFileProvider
and H5WasmBufferProvider, that can read HDF5 files straight in the browser
thanks to the h5wasm library.
Demos
The demo app demonstrates the use of the built-in data providers and visualizations. Several demos are available, one per data provider:
- H5GroveProvider
- HsdsProvider
- H5WasmLocalFileProvider (when browsing for a local file)
- H5WasmBufferProvider (when supplying the URL of a remote file)
- MockProvider
Ecosystem
Check out these projects from the H5Web ecosystem:
- myHDF5 – online HDF5 file viewing service
- jupyterlab-h5web – H5Web extension for JupyterLab
- vscode-h5web – H5Web extension for Visual Studio Code
- h5whale – full-stack Docker application to visualise HDF5 files
- h5grove – core utilities to serve HDF5 file contents
Contributing
Want to help improve H5Web? We're always looking for feedback, bug reports and feature requests, so don't hesitate to open an issue or start a discussion.
If you'd like to know more about contributing to the codebase, please check out the CONTRIBUTING guide.
