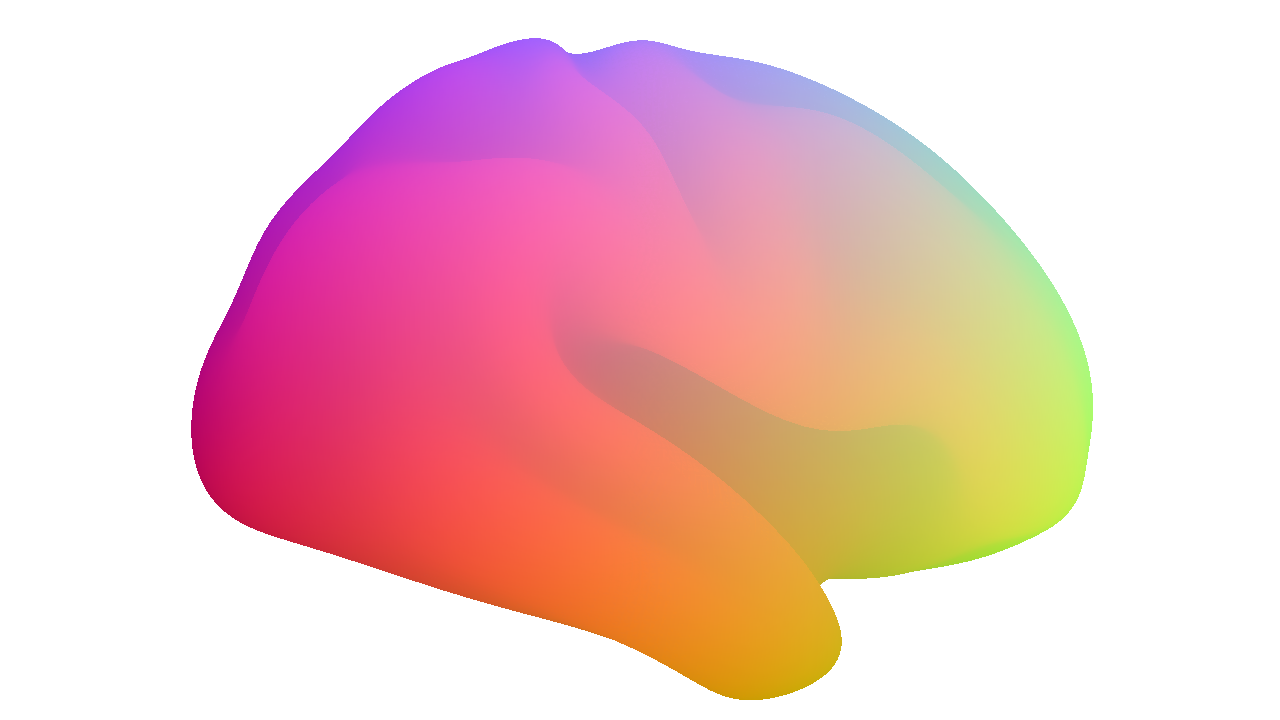
Cerebro_Viewer
A pythonic 3D viewer to visualize and plot brains and neuroimaging data

Citing Cerebro:
Thanks for choosing Cerebro! We're honored to have you as a user. If you end up using our code in your project or research (which we hope you will!), we'd be grateful if you could give us a little shout-out by including the citation in your publication. This helps us spread the word, motivates us to keep making Cerebro better, and gives us warm and fuzzy feelings inside! 😊 Here's the reference you can use to site the package:
Sina Mansour L. (2023). Cerebro_Viewer A Pythonic 3D viewer to visualize and plot brains (v0.0.9). Zenodo. https://doi.org/10.5281/zenodo.7885669
Cerebro is a work in progress, and we're excited to share more with you soon! We're working on a manuscript that will showcase Cerebro's capabilities. Once that's published, appropriate references will be added here.
Cerebro aims to provide a solution to advance the currently available methods for visualization of neuroimaging and brain connectivity data.
Installation
Cerebro is provided as a python package and requires Python 3. To install the latest Cerebro release, simply run the following command:
pip install Cerebro-Viewer --upgrade
Motivation
Were you ever stuck when trying to visualize your study findings? Did you want to visualize different data formats and notice there’s no software to visualize them ALL in one place? Have you thought about a different way to present your findings but couldn’t find a tool to do it? Have you ever wondered if it would be possible to provide reproducible neuroimaging visualizations along your publications? Do you find limitations in current neuroimaging visualization software? And finally, did you ever want to generate nice brain visualizations within your script (without launching third-party software) and found the existing packages incapable/slow? Cerebro aims to provide a solution that tries to answer these needs.
Development plan
Cerebro is currently under active development. The plan is to further develop exciting features through open-source contributions and discussions during hackathons, brainhacks, and other relevant opportunities. Checkout the contributors page to find out more.
If you are looking for a visualization that is currently missing from Cerebro, please open a new issue to suggest the development of that feature.
To try the package, you could check out a range of notebooks and example scripts that showcase Cerebro's capabilities.
After installation, you may alternatively run the following code (inside python) to get Cerebro's visualizations in an interactive GUI:
from cerebro import cerebro_brain_utils as cbu
from cerebro import cerebro_brain_viewer as cbv

my_brain_viewer = cbv.Cerebro_brain_viewer()

# render a surface
surface = 'pial'
surface_model = my_brain_viewer.load_template_GIFTI_cortical_surface_models(surface)

cifti_space = my_brain_viewer.visualize_cifti_space()

# render data over surface
dscalar_file = cbu.get_data_file(f'templates/HCP/dscalars/hcp.gradients.dscalar.nii')
dscalar_layer = my_brain_viewer.add_cifti_dscalar_layer(dscalar_file=dscalar_file,)

# enter interactive view
my_brain_viewer.show()