Thruk Grafana Datasource - a Grafana backend datasource using Thruks REST API

Installation
Search for thruk in the Grafana plugins directory or simply use the grafana-cli command:
%> grafana-cli plugins install sni-thruk-datasourceAlso OMD-Labs comes with this datasource included, so if you use OMD-Labs, everything is setup already.
Otherwise follow these steps:
%> cd var/grafana/plugins
%> git clone -b release-1.0.4 https://github.com/sni/grafana-thruk-datasource.git
%> restart grafana
Replace release-1.0.4 with the last available release branch.
Create Datasource
Add a new datasource and select:
Use the Grafana proxy.
- Type 'Thruk'
- Url to Thruk, ex.: 'https://localhost/sitename/thruk'
Table Queries
Using the table panel, you can display most data from the rest api. However only text, numbers and timestamps can be displayed in a sane way. Support for nested data structures is limited.
Select the rest path from where you want to display data. Then choose all columns. Aggregation functions can be added as well and always affect the column following afterwards.
Variable Queries
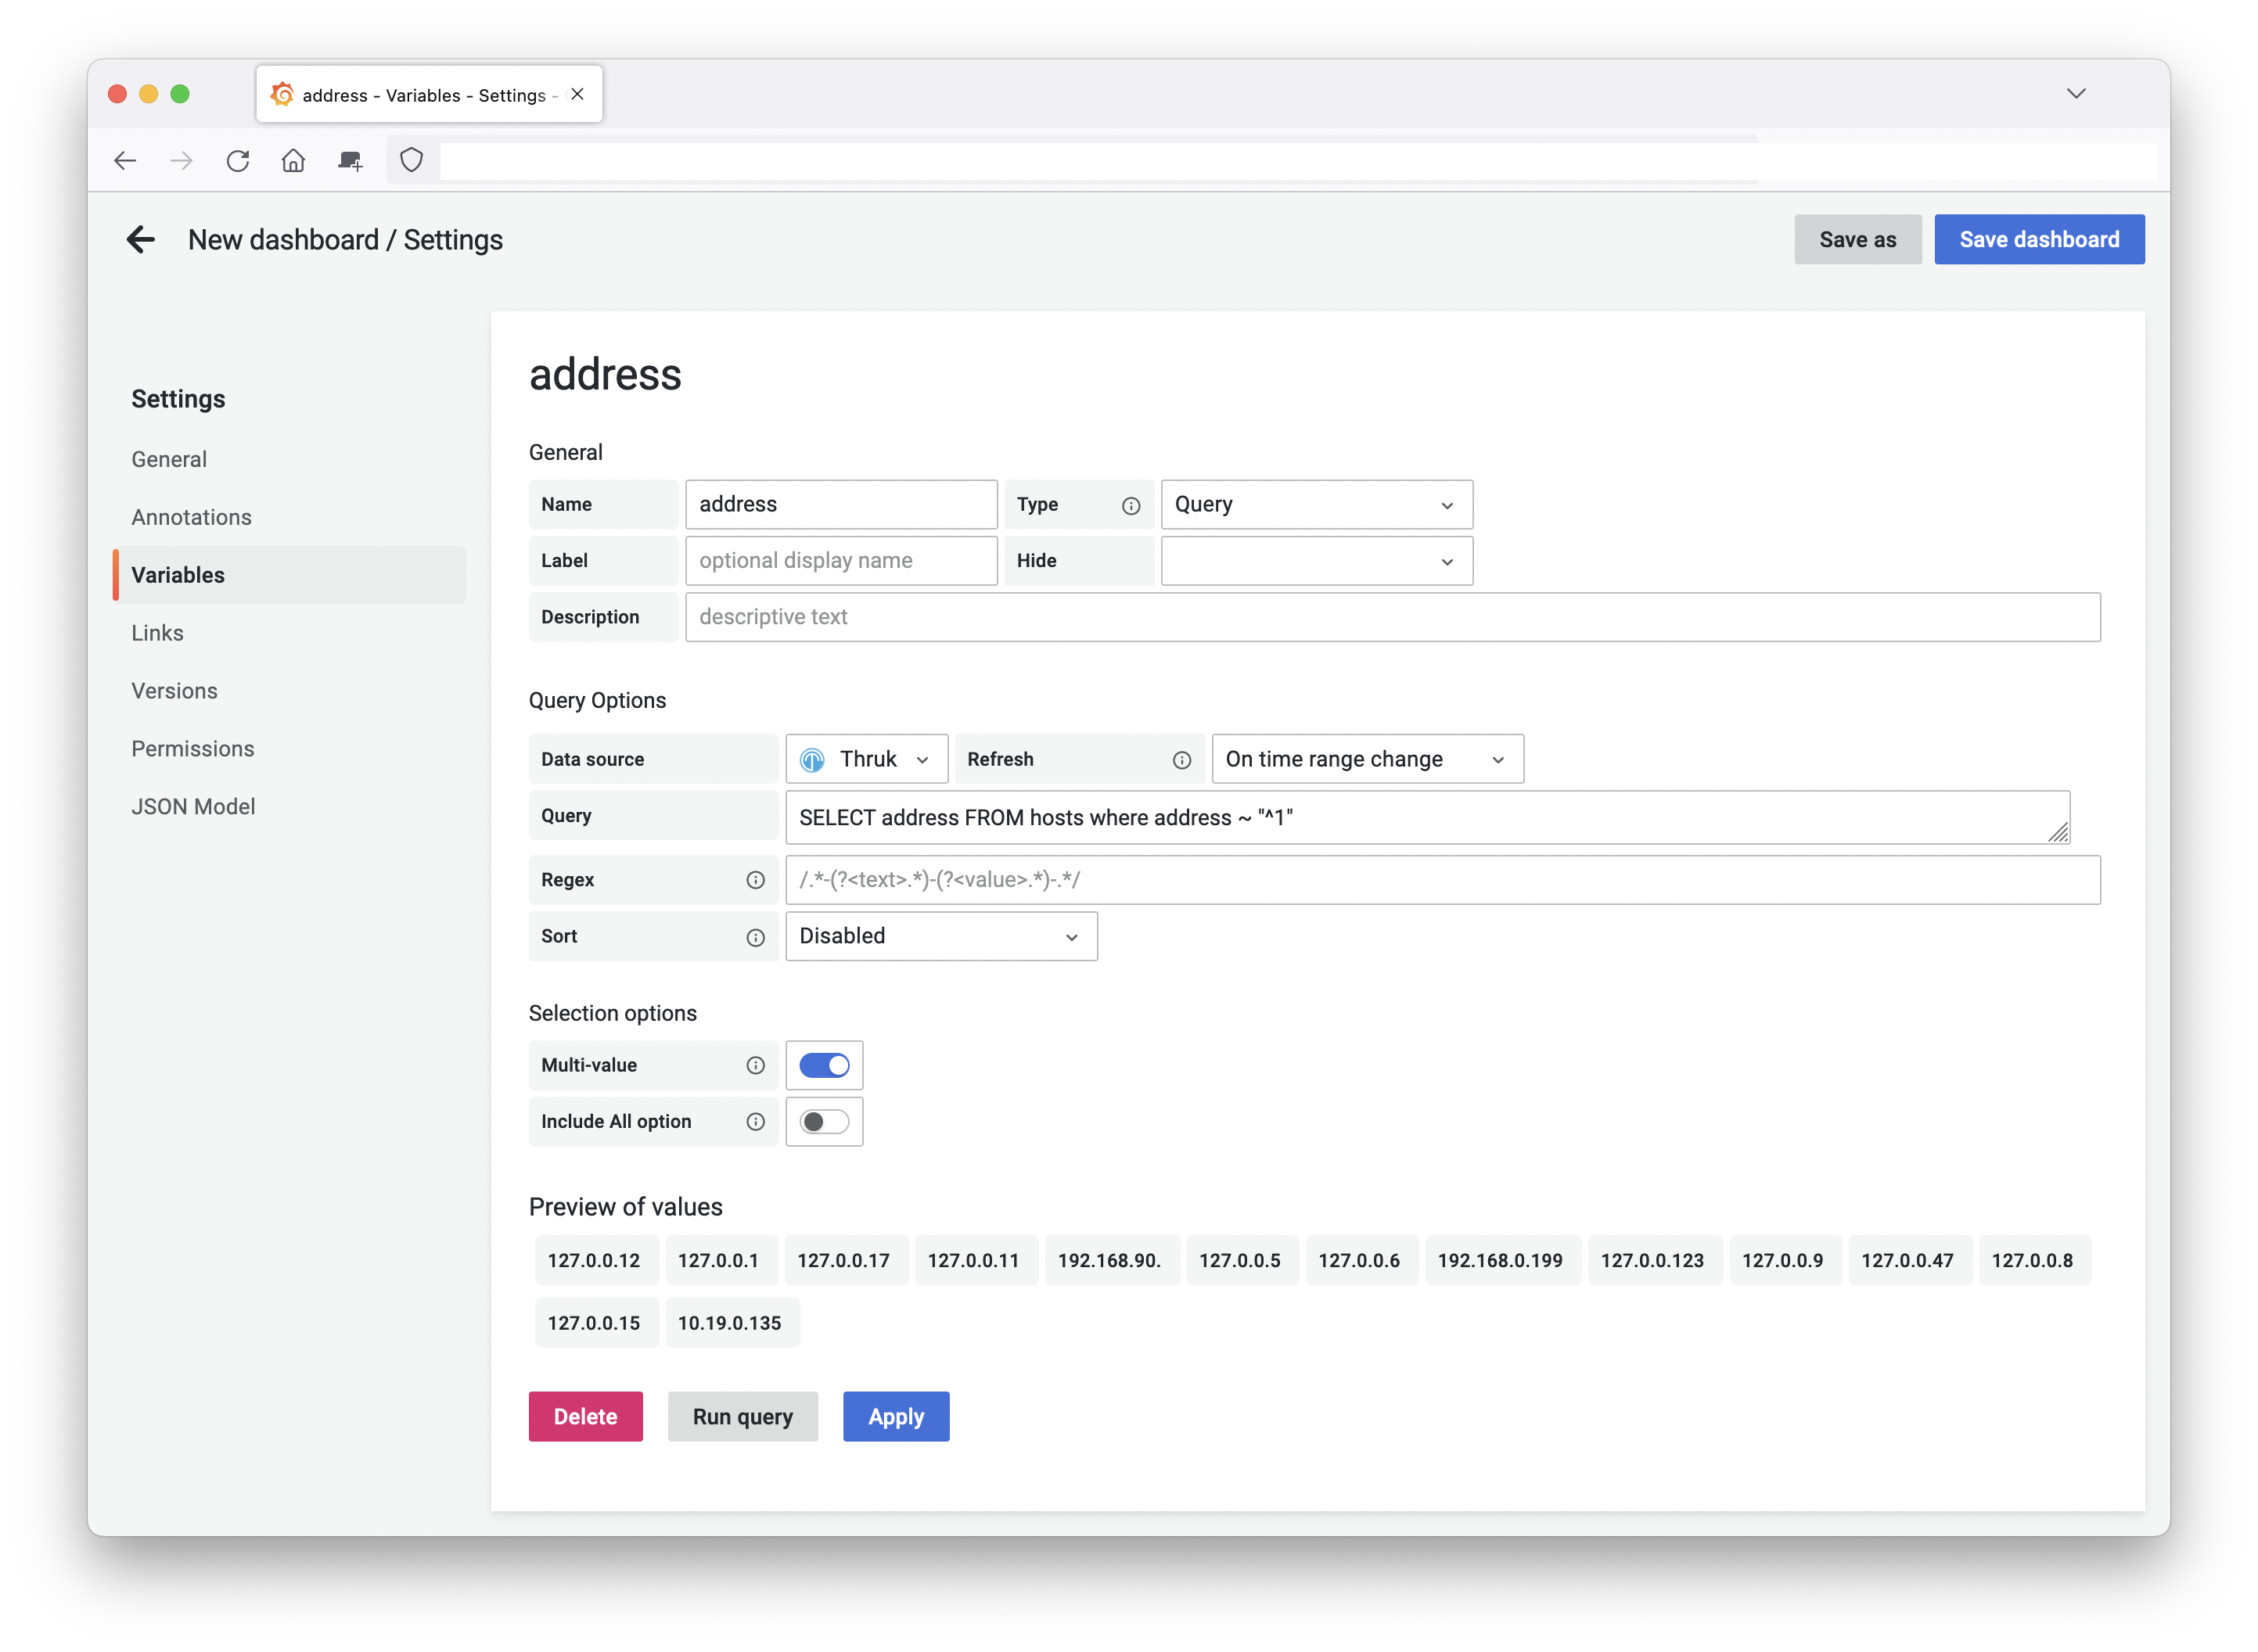
Thruks rest api can be used to fill grafana variables. For example to get all hosts of a certain hostgroup, use this example query:
SELECT name FROM hosts WHERE groups >= 'linux'Annotation Queries
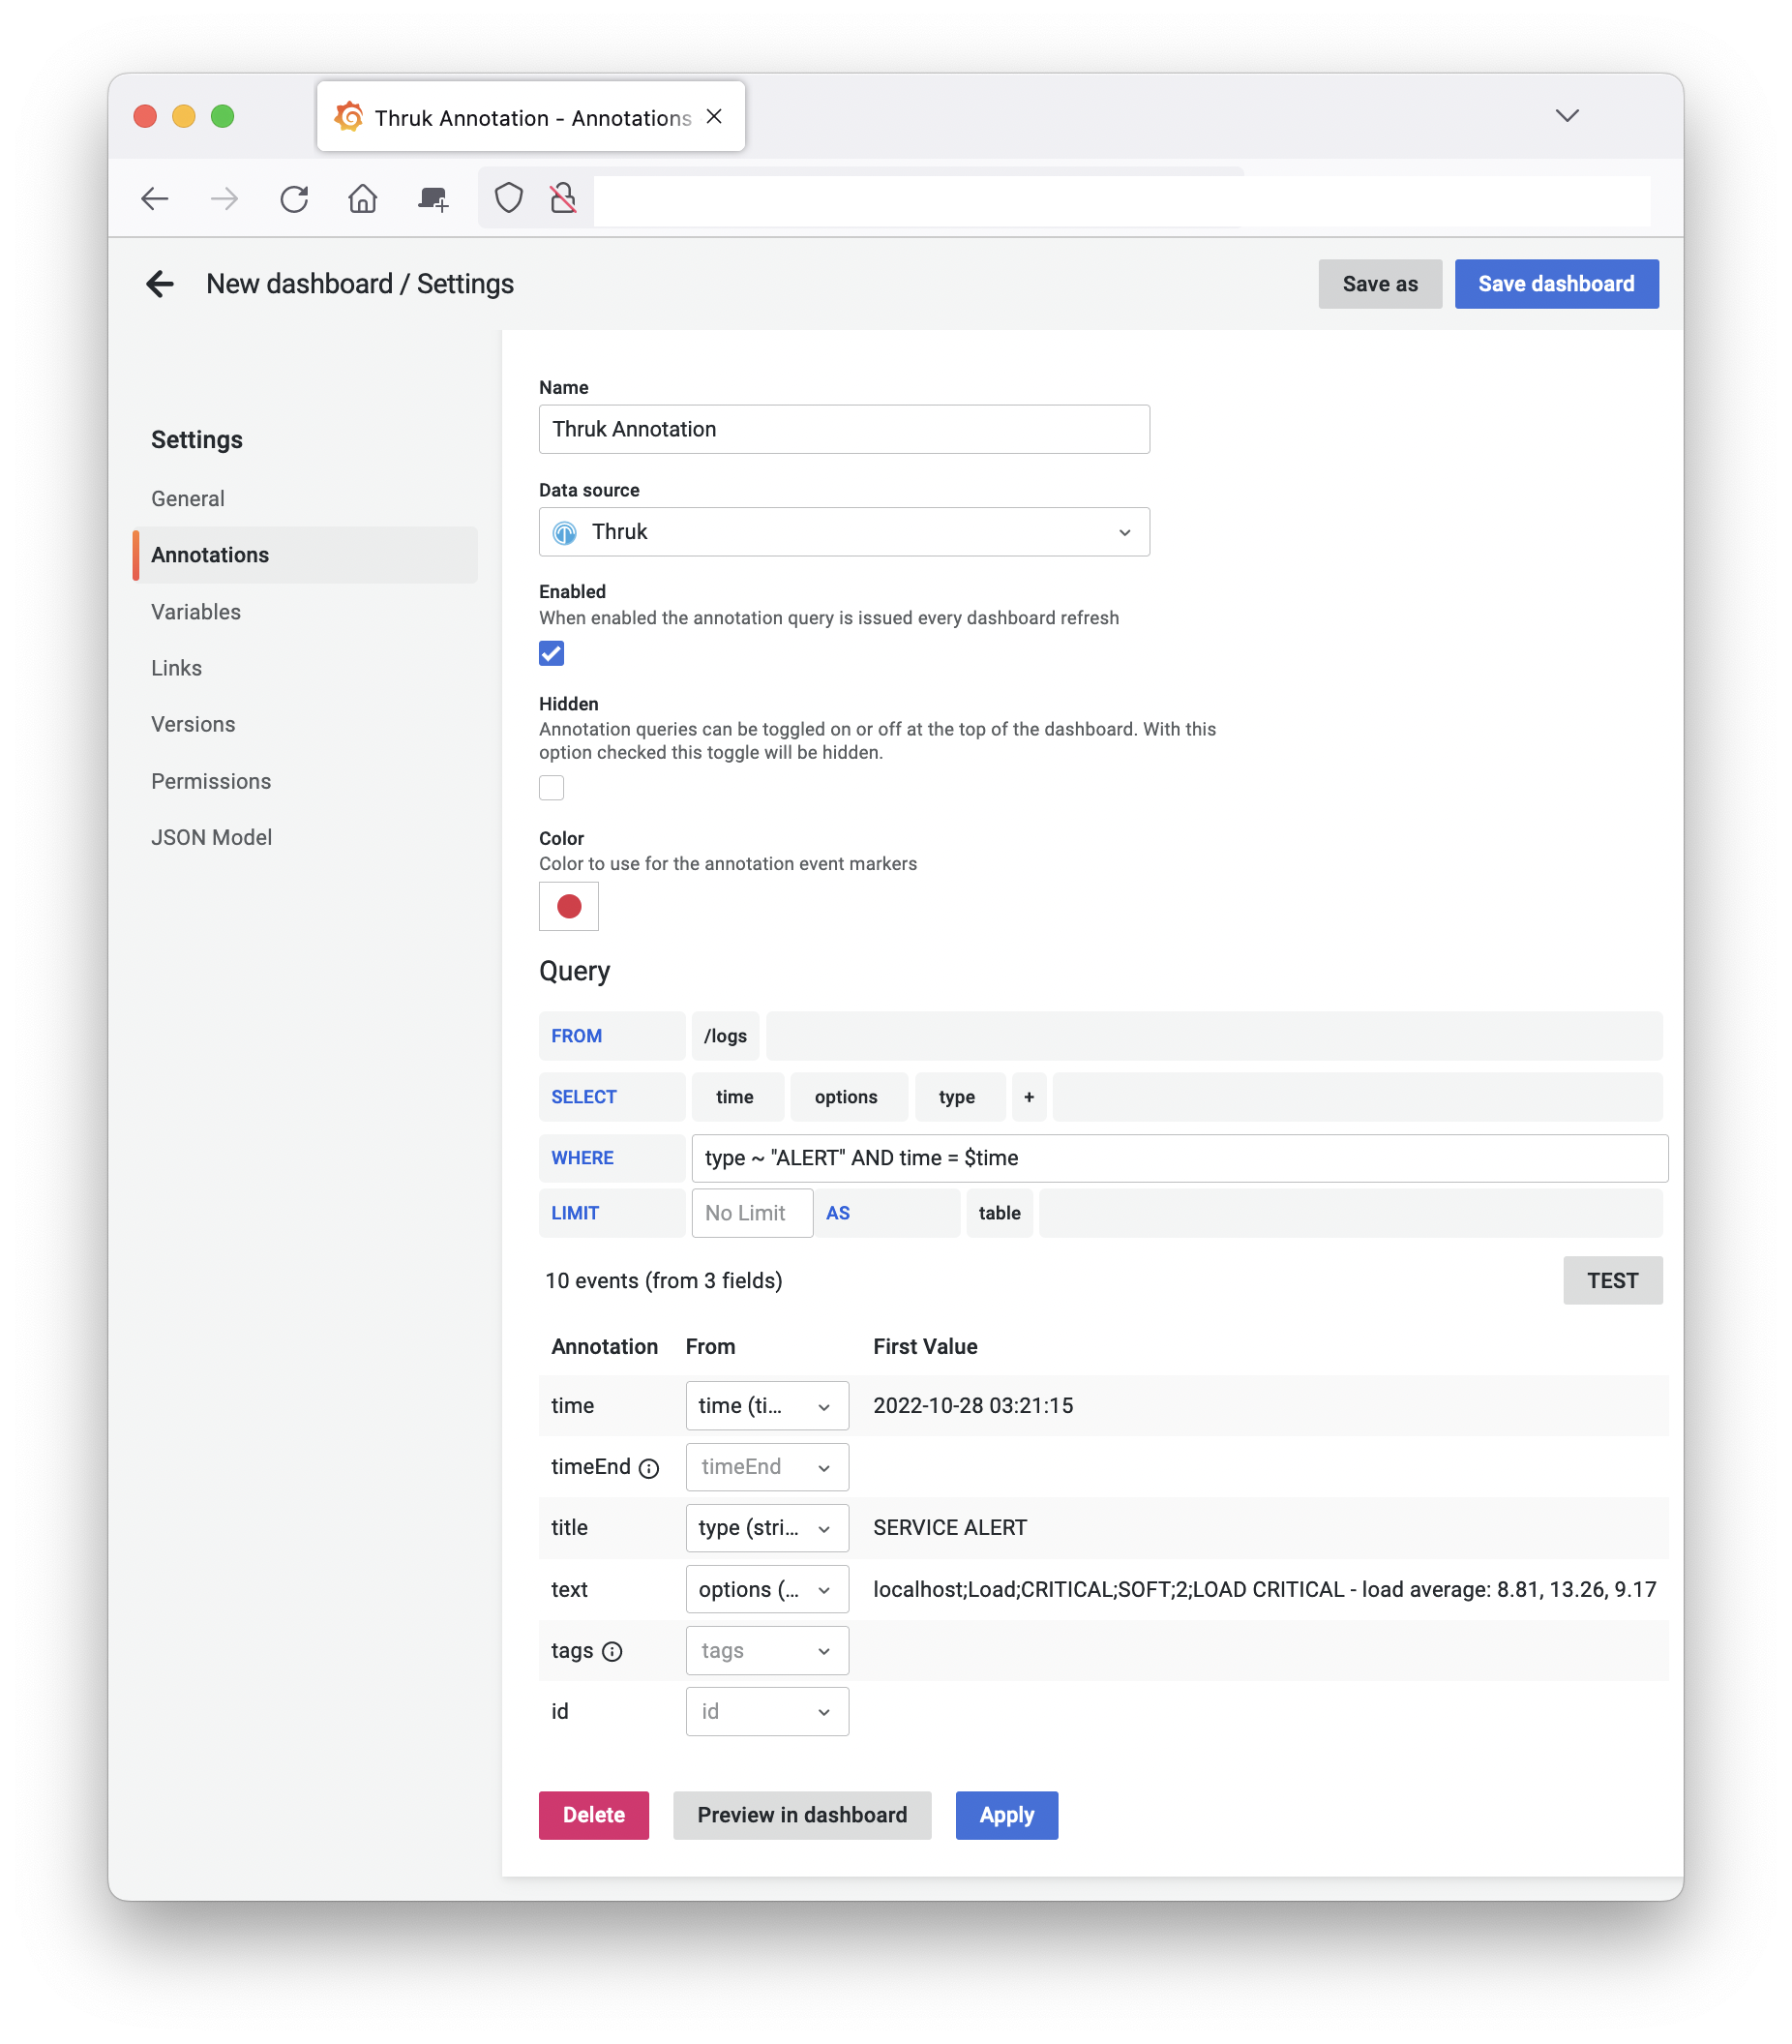
Annotation queries can be used to add logfile entries into your graphs. Please note that annotations are shared across all graphs in a dashboard.
It is important to use at least a time filter.

Single Stat Queries
Single stats are best used with REST endpoints which return aggregated values
already or use aggregation functions like, avg, sum, min, max or count.
Timeseries based panels
Althouth Thruk isn't a timeseries databases und usually only returns table data, some queries can be converted to fake timeseries if the panel cannot handle table data.
You can either use queries which have 2 columns (name, value) or queries which only return a single result row with numeric values only.
Statistic Data Pie Chart
For example the pie chart plugin can be used with stats queries like this:
SELECT count() state, state FROM /hostsThe query is expected to fetch 2 columns. The first is the value, the second is the name.
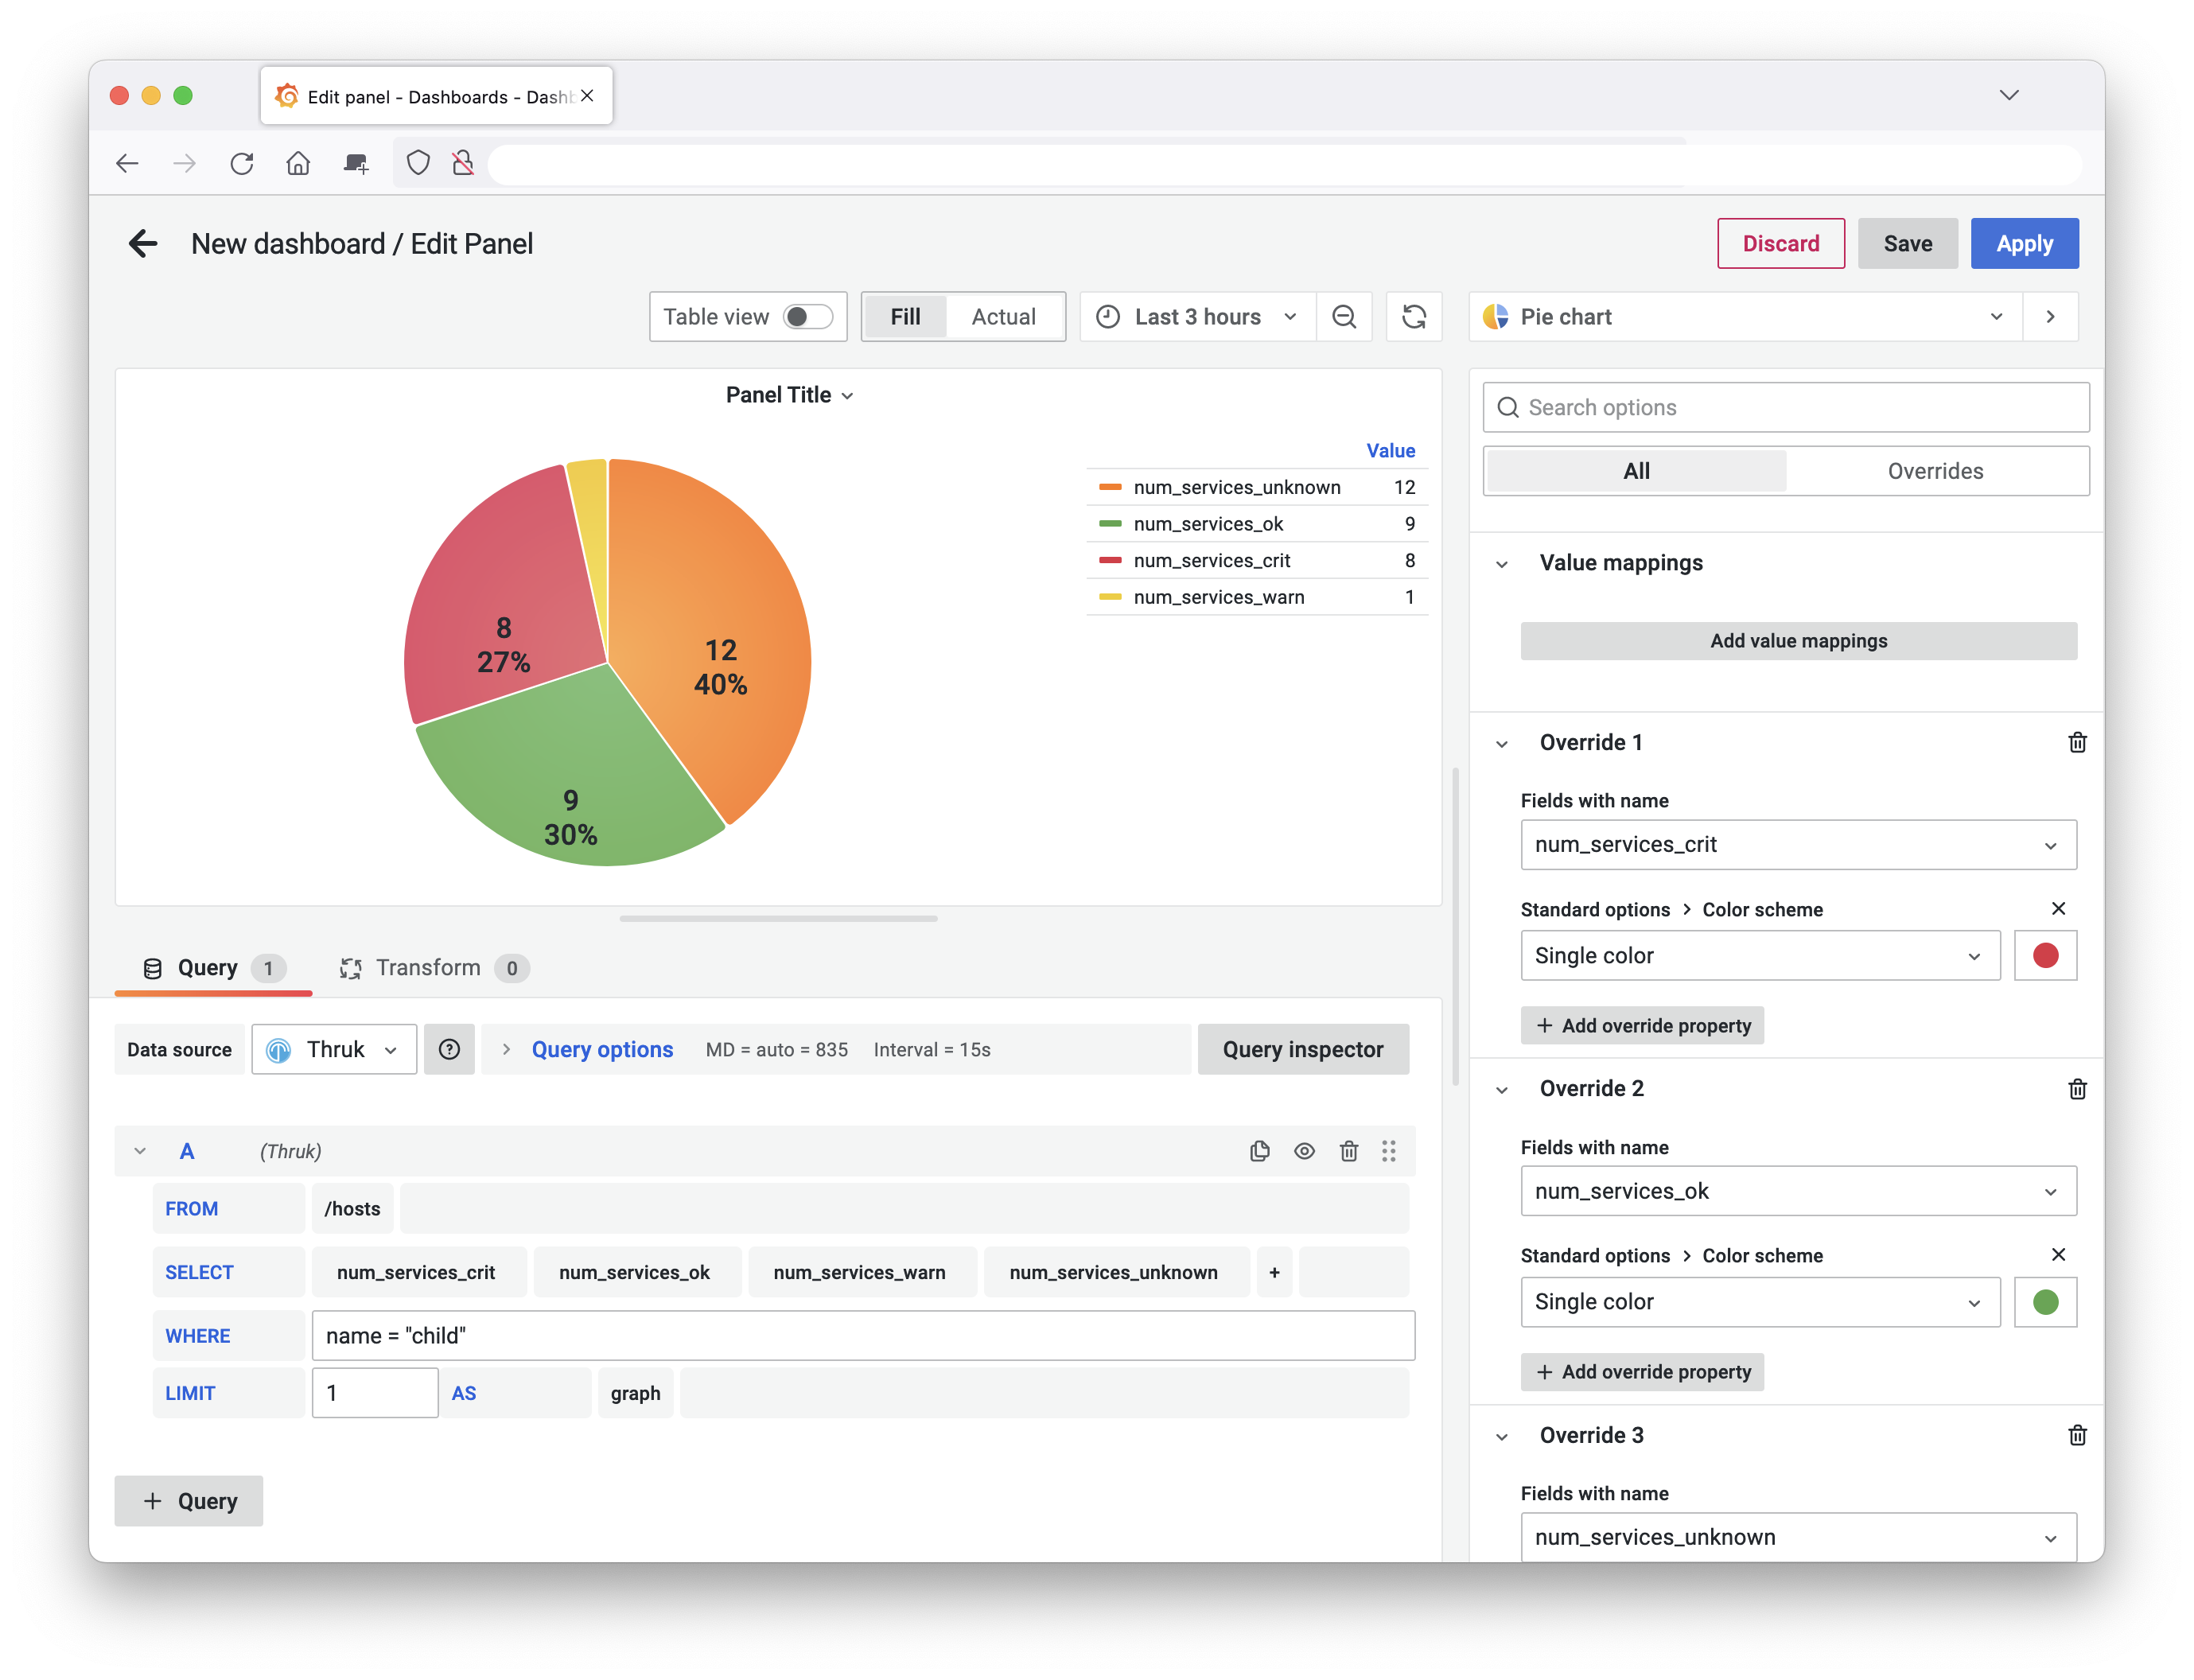
Single Host Pie Chart
Ex.: Use statistics data for a single host to put it into a pie chart:
SELECT num_services_ok, num_services_warn, num_services_crit, num_services_unknown FROM /hosts WHERE name = '$name' LIMIT 1
Using Variables
Dashboard variables can be used in almost all queries. For example if you
define a dashboard variable named host you can then use $host in your
queries.
There is a special syntax for time filter: field = $time which will be
replaced by (field >= starttime AND field <= endtime). This can be used to
reduce results to the dashboards timeframe.
SELECT time, message FROM /hosts/$host/alerts WHERE time = $timewhich is the same as
SELECT time, message FROM /alerts WHERE host_name = "$host" AND time = $time
Development
To test and improve the plugin you can run Grafana instance in Docker using following command (in the source directory of this plugin):
%> make dev
This will start a grafana container and a build watcher which updates the plugin is the dist/ folder.
The dev instance can be accessed at `http://localhost:3000``
Note: You need to add the datasource manually and you need to run "make build" once before starting the dev container, otherwise Grafana won't find the datasource.
Testing
For testing you can use the demo Thruk instance at:
- URL: https://demo.thruk.org/demo/thruk/
- Basic Auth: test / test
Create Release
How to create a new release:
%> export RELVERSION=1.0.7
%> export GRAFANA_ACCESS_POLICY_TOKEN=...
%> vi package.json # replace version
%> vi CHANGELOG.md # add changelog entry
%> git commit -am "Release v${RELVERSION}"
%> git tag -a v${RELVERSION} -m "Create release tag v${RELVERSION}"
%> make GRAFANA_ACCESS_POLICY_TOKEN=${GRAFANA_ACCESS_POLICY_TOKEN} releasebuild
# create release here https://github.com/sni/grafana-thruk-datasource/releases/new
# submit plugin update here https://grafana.com/orgs/sni/plugins
Changelog
see CHANGELOG.md