Description
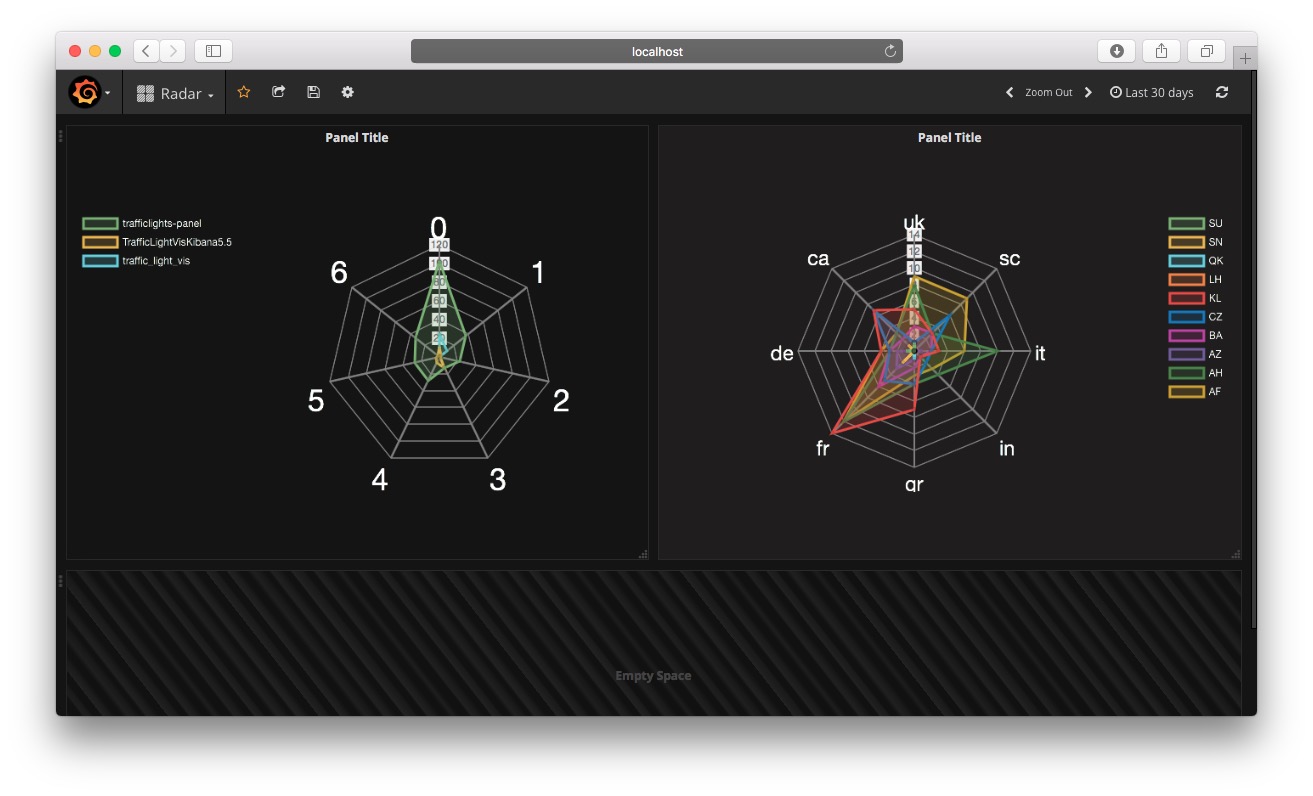
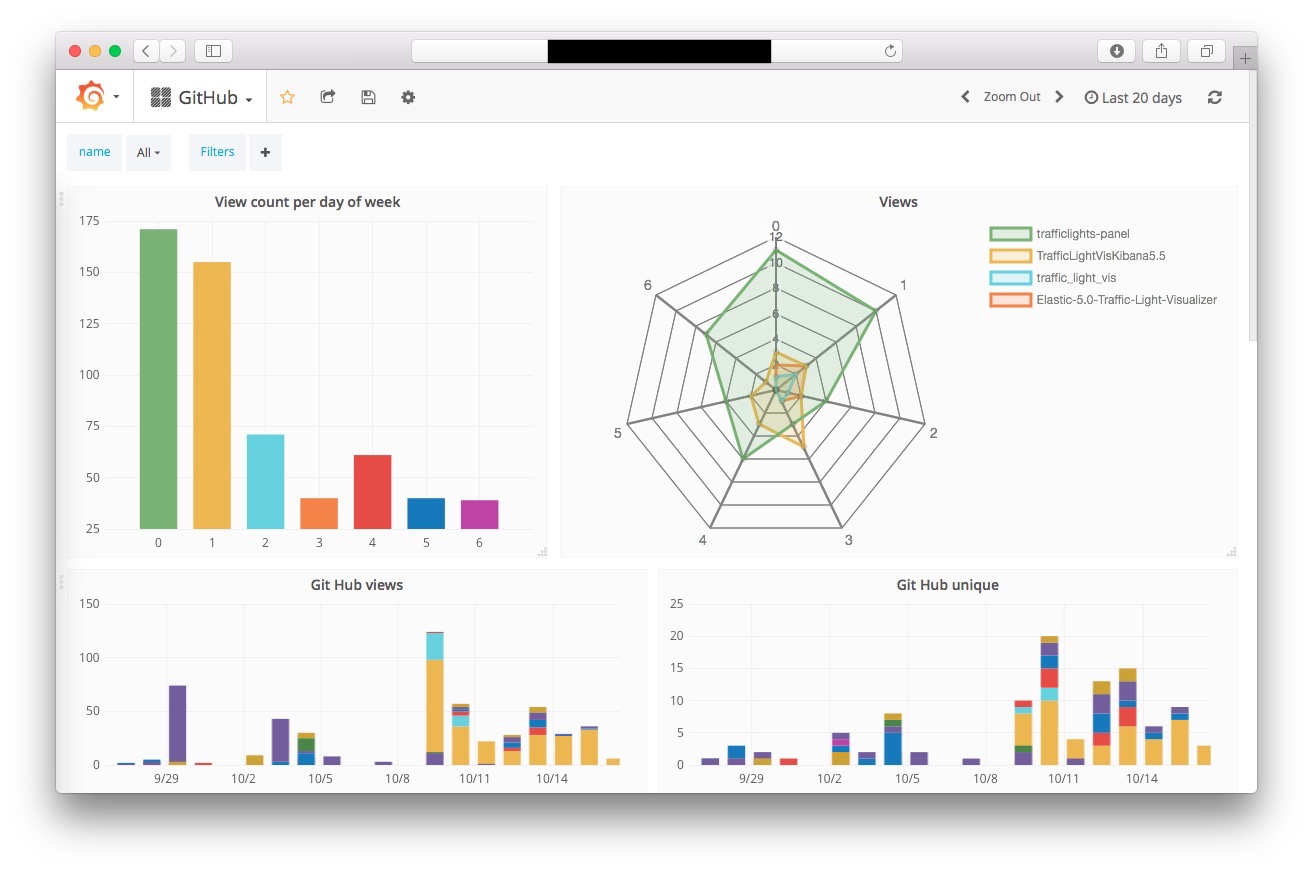
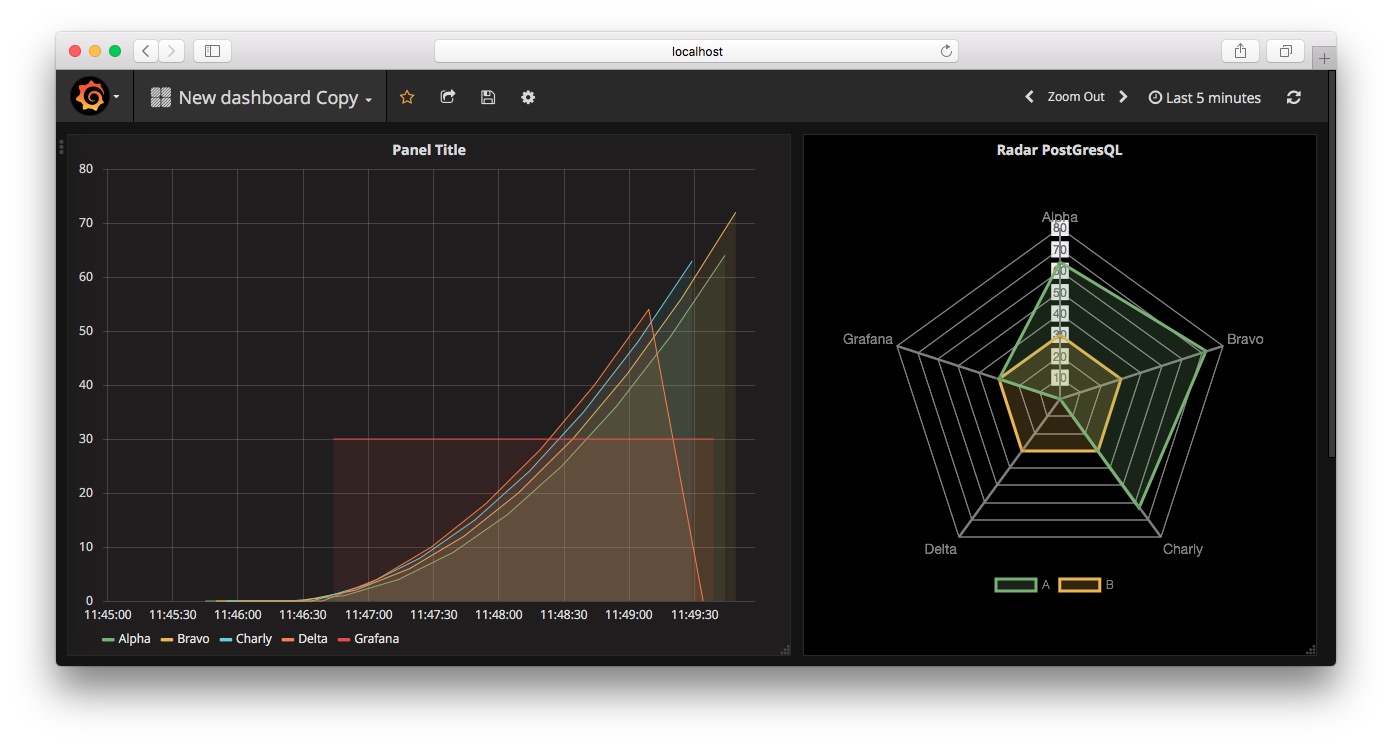
This grafana panel displays radar graphs using the Chart.JS library. (http://www.chartjs.org/)
The plugin was tested with:
- Elastic Search 5.5 as data source.
- InfluxDB 1.3.6
- PostGreSQL
- MariaDB
Installation
Copy the dist folder in your grafana plugin directory and rename it to radarpanel.
Compile
Run
- npm i
- grunt
Screenshots
Showcase
Metrics Configuration
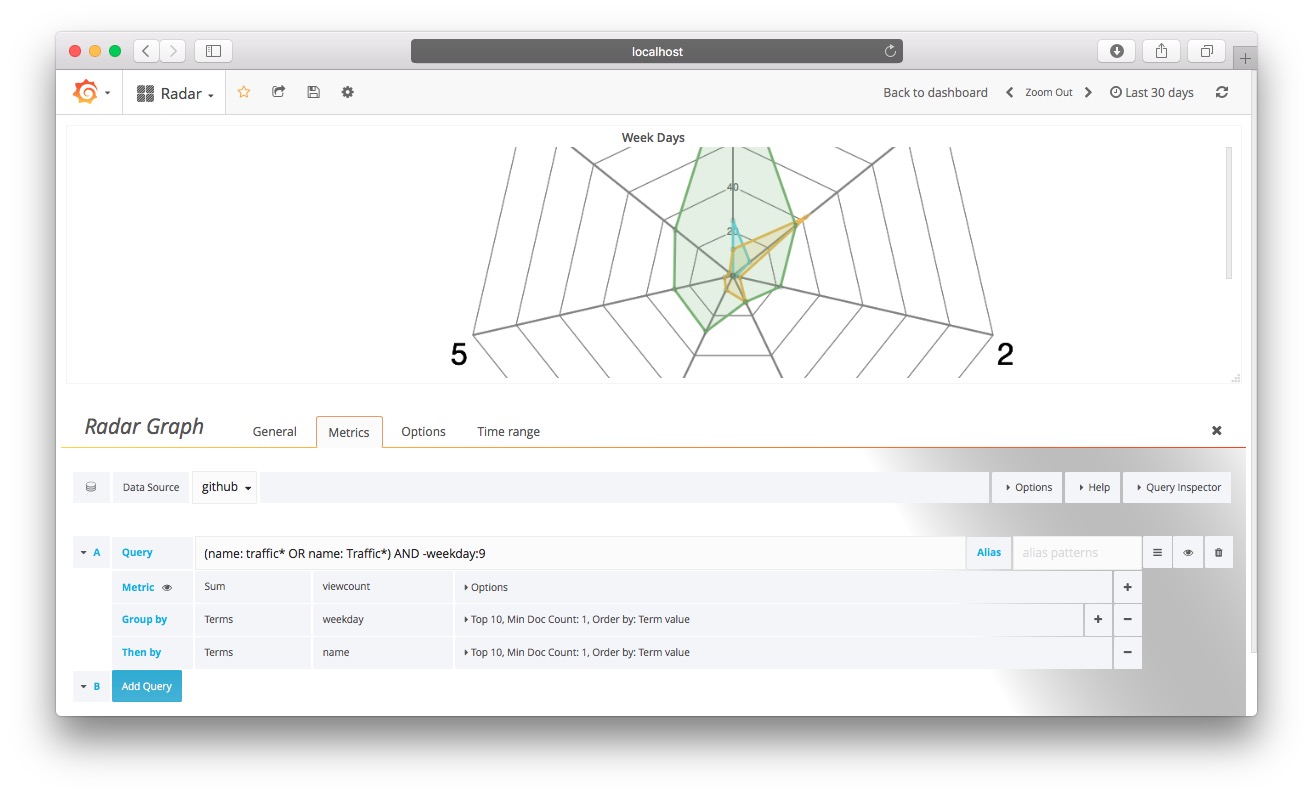
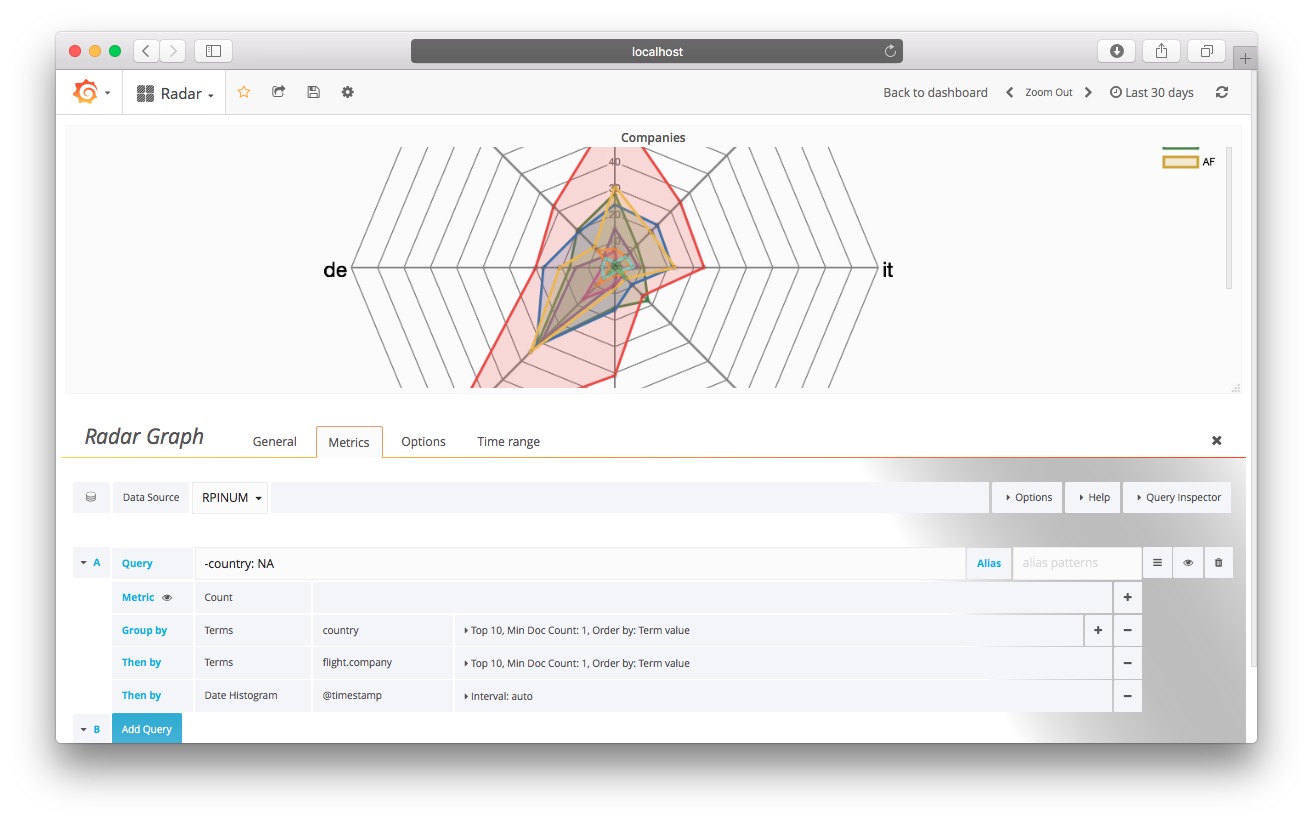
Elastic Search Configuration
The panel datasource must include a single query having the following characteristics:
- A single group (No date histogram)
- Two groups (No date histogram)
- Three groups. In this case the last group is a date histogram (As shown in the following screenshot) The value used is the last time serie point of the aggregation.
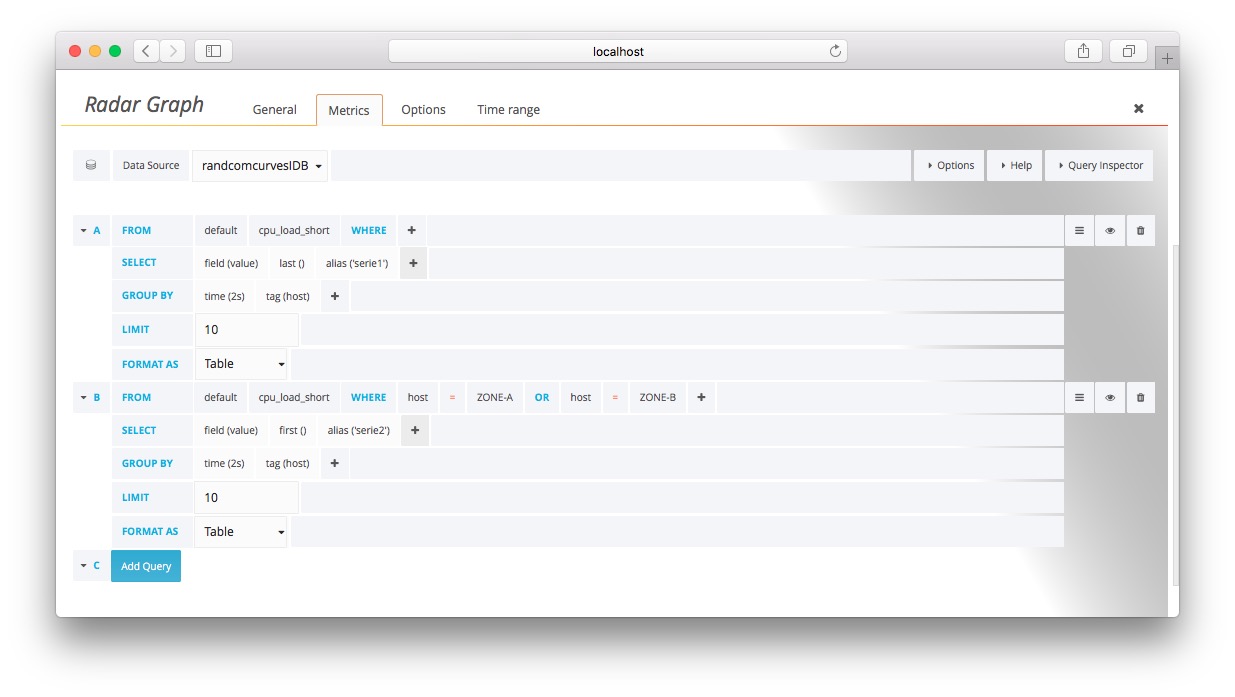
Influx DB Configuration
Note that the checkbox Ingnore TIME (InfluxDB) checkbox must be checked in the Options panel.
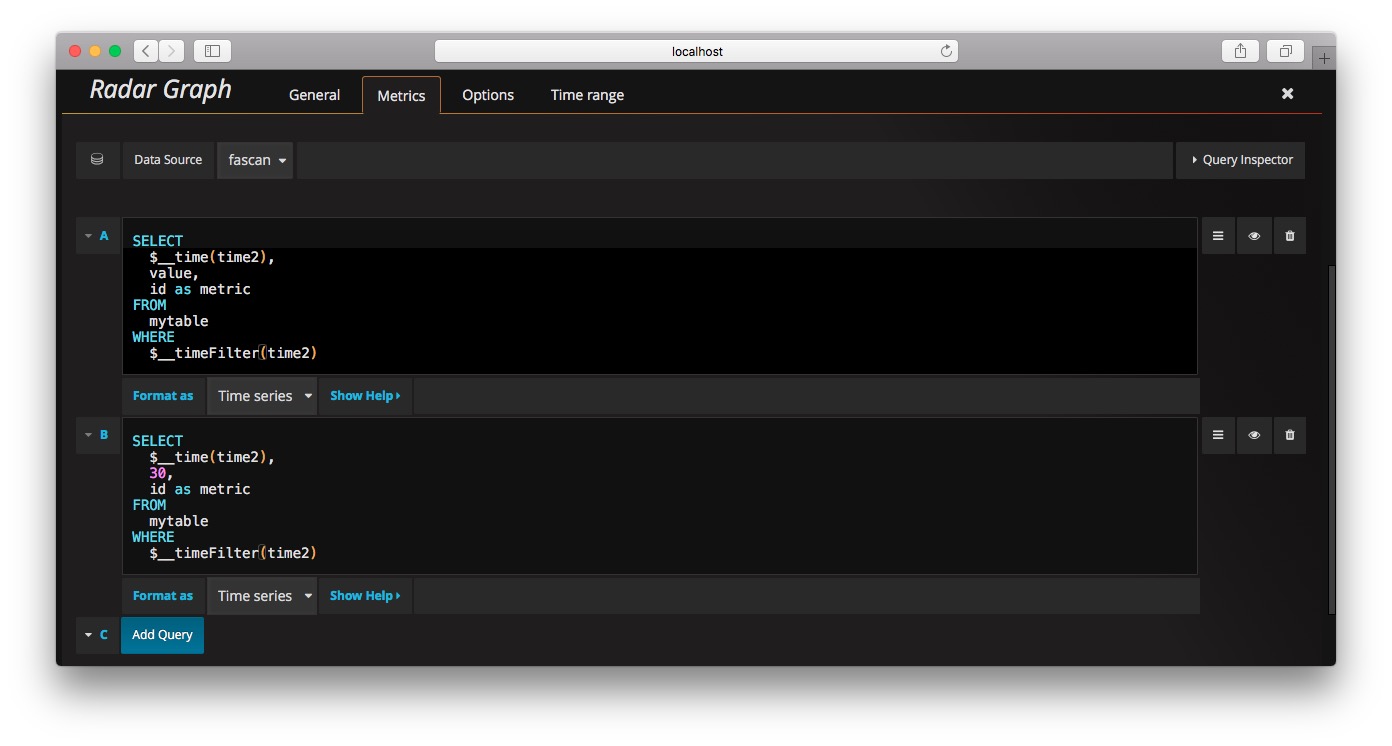
PostGreSQL configuration
Note the graph displays the last value of each time serie.
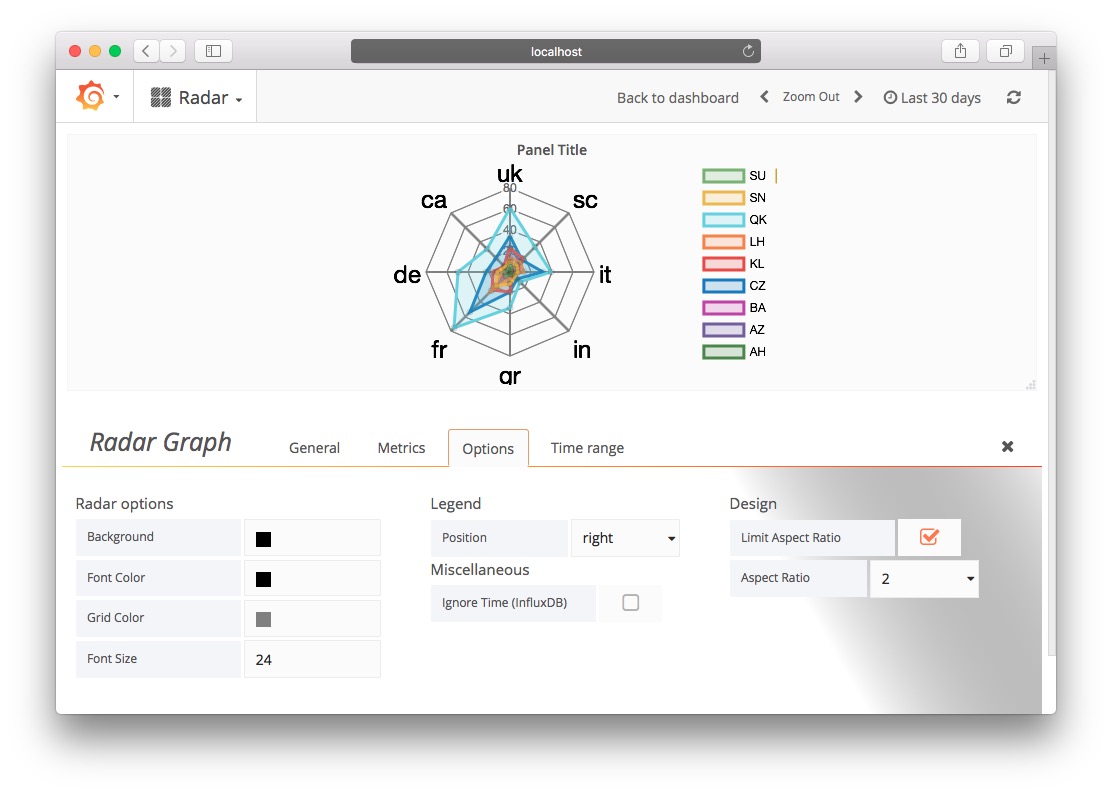
Panel Options
Versions
v1.1.0 (19/Oct/2017)
- First Version Compatible with InfluxDB
v1.2.0 (27/Oct/2017)
- Panel renamed to snuids-radar-panel. (Edit your panels plugin id when upgrading from 1.1.0)
v1.3.0 (01/Nov/2017)
- Aspect ratio option added in order to limit the height of the graph
v1.4.0 (10/Dec/2017)
- PostGreSQL support added
v1.4.1 (12/Dec/2017)
- Fixed a bug that prevents the graph to be corrrectly displayed when the serie has only one point. (Thx shizacat)
v1.4.2 (30/Sep/2018)
- Alias option added in order to rename the serie for SQL datasources
v1.4.3 (06/Mar/2019)
- Merged fremag modifications: New chart options: min, max, step, animation
v1.4.4 (20/Apr/2019)
- Autoscale option added
- Tick background can be hidden
v1.5.0 (17/Jan/2022)
- Plugin signed
v1.5.1 (18/Jan/2022)
- this.renderingCompleted() added at the end of OnRender (Issue of GZRad)