RStudio-Table-Contest
Stephan Teodosescu's repo for the 2021 RStudio Table Contest
Abstract:
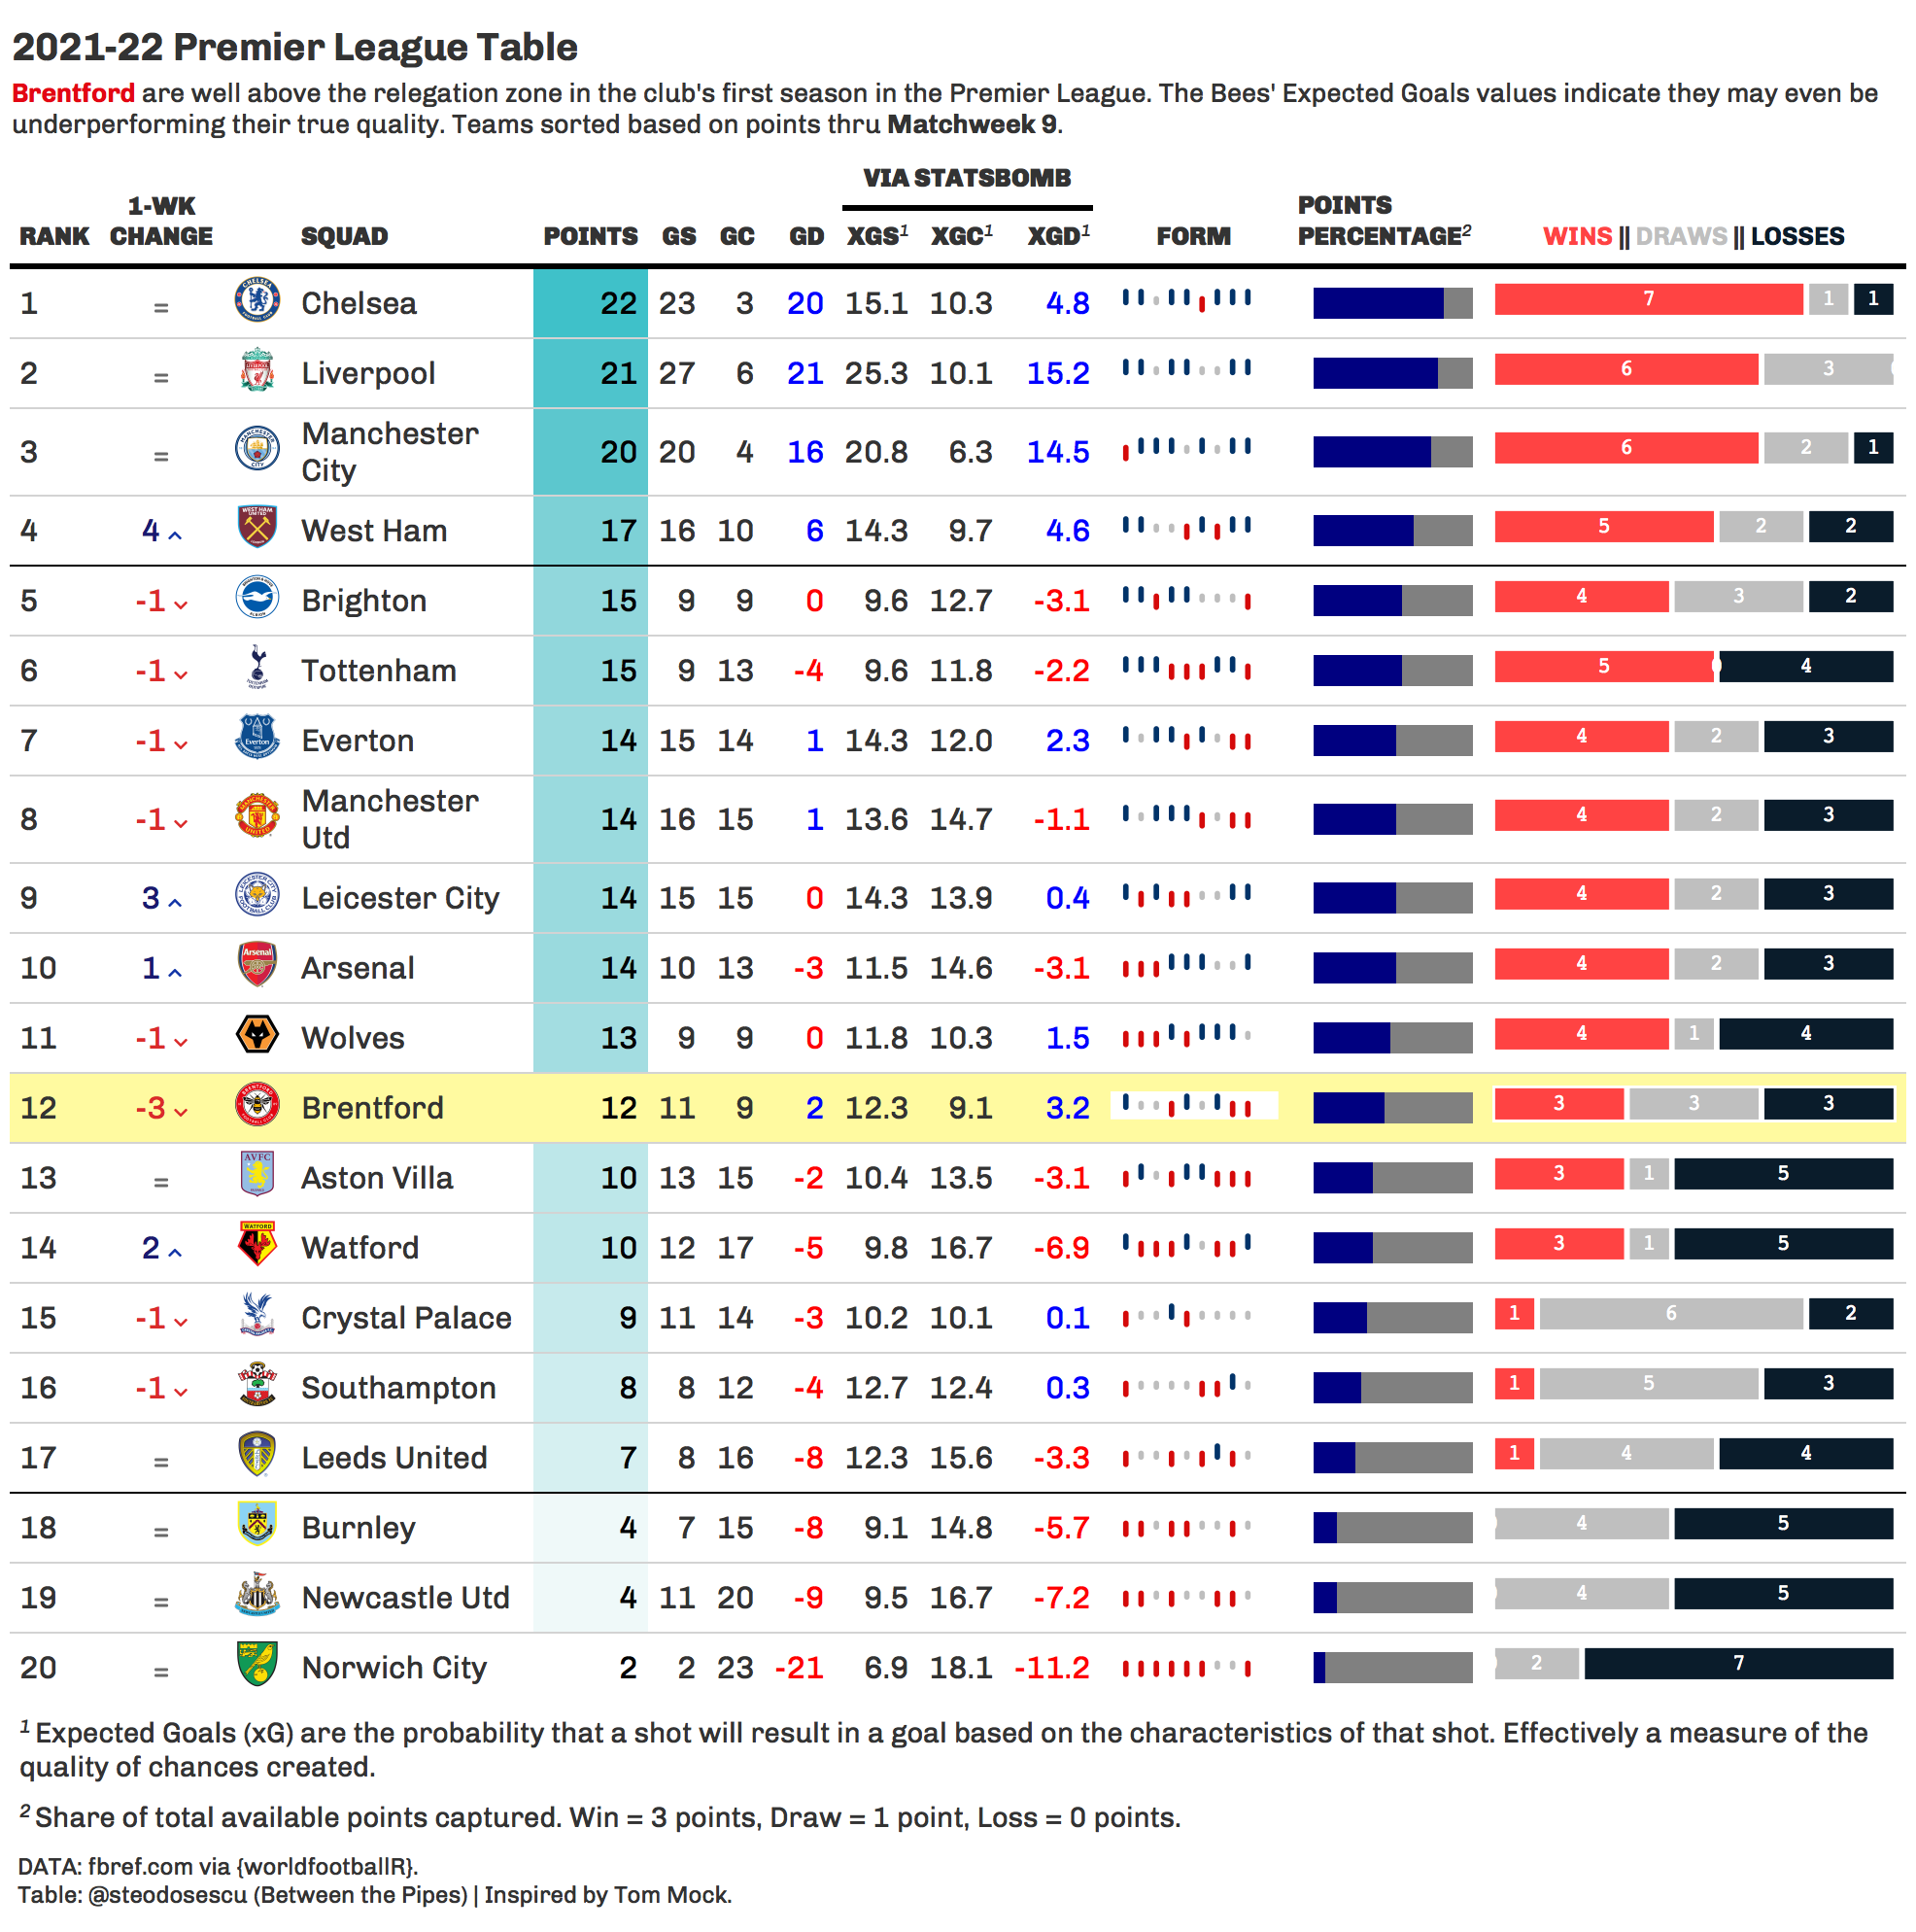
This table shows the 2021-22 English Premier League standings as of Matchweek 9. Along with several metrics to identify team performance thus far into the season, I've highlighted Brentford, a newly-promoted club I'm rooting for this season.
Full Description:
My table heavily leans on the fantastic {gt} and {gtExtras} packages and was inspired by several of Tom Mock's blog posts showing examples of how to properly display visual information in tabular format. While my personal philosophy is simple is better, I'll admit I tried to use as many functions and features of the aforementioned packages as possible in this contest. The table includes the following fields:
- Rank
- Team/logo
- Points (as of Matchweek 9 of the current English Premier League season)
- Traditional goals stats: Goals Scored, Goals Conceded, Goal Differential
- Advanced goals stats: Expected Goals Scored (xGS), Expected Goals Conceded (xGC), Expected Goal Differential (xGD)
- Form (outcomes of each match so far in terms of wins, draws, and losses)
- Points Percentage
- Win/Draws/Losses
Details
- Table Type: static-HTML
- Submission Type: Single Table Example
- Table: Link
- Repo: https://github.com/steodose/RStudio-Table-Contest
- RStudio Cloud:
- DT package used: false
- gt package used: true
- reactable package used: false
- flextable package used: false
- huxtable package used: false
- kableExtra package used: false
- Other packages: tidyverse, gtExtras