Turbo
A minimalistic frontend for the gdb debugger.
I will most probably not be able to continue working on this project (lack of time). At this moment, this project is usable, and has been successfully used for debugging C programs for ARM Cortex-M microcontrollers, with the blackmagic probe.
If you decide to give this program a try, I hope that you will find it useful!
Please, do report any issues that you have on the github page of this project. I will try to address any issues, but I can make no promises. Still, it is best to be aware of any known issues. Thank you!
Motivation
Why another gdb frontend? There are already so many good gdb frontends, so why another one?
This frontend attempts to be a minimalistic, very thin wrapper around the gdb debugger, with a focus on remote debugging. Native debugging has its own challenges and peculiarities, and is currently out of scope for this frontend. Also, attempts are made to seamlessly interface with the powerful blackmagic probe. At the moment, the frontend only supports connecting to the blackmagic probe hardware directly. However, another, potentially much more powerful possibility exists - connecting to the blackmagic hosted variant, which supports more hardware probes, and has enhancements not present in the blackmagic probe firmware. Such support is intended to be added in the future.
This frontend works best when debugging programs written in the C programming language. Of course, debugging programs written in any language supported by gdb is available, but the best debugging experience is with programs written in the C programming language.
Building the software
All of the prerequisite libraries (currently, this is only the ELFIO library) are provided in the project's github repository. The software is released under an MIT license. The Qt framework is being used for driving the graphical user interface. The Qt framework is freely available for download for non-commercial use. If you are downloading the Qt framework package for the first time, you may find it unusually hard to locate the list of offline installer packages, so here is a direct link to the Qt offline installers. Installing the Qt package, however, requires performing a free registration on the Qt site.
An alternative is to use an installer package for your Linux system, that should work as well. I personally prefer to use the official Qt installers. If you decide to download Qt from the official site, remember to make the downloaded file executable (chmod +x installer-package) before running it.
There are two ways to build the software - use the qmake and make utilities from the command line, or perform building from the Qt Creator IDE (which, eventually, will run qmake and make to perform the build). I personally prefer using the IDE, because it is very convenient for making changes to the user interface through its interactive user interface editor.
To build the software from the Qt Creator IDE, start the IDE, open the project file - turbo.pro, and build the project. That is all.
To build from the command line:
- for Windows systems, open a shell (command window) that is preconfigured for executing Qt builds. You will find such a preconfigured command shell as part of the Qt installation on Windows. Create an empty directory that will contain the built files, and perform the building there:
# Get the sources from github git clone https://github.com/stoyan-shopov/turbo # Create a directory to contain the build files mkdir turbo-build cd turbo-build qmake ../turbo/turbo.pro -spec win32-g++ "CONFIG+=debug" mingw32-make # The built executable is 'debug/turbo.exe' - the procedure is similar for Linux systems. However, there are some prerequisites that you may need - these are an
ncurseslibrary that may be needed in order to be able to run thearm-none-eabi-gdbdebugger, and themesa-libGLdevelopment library that may be needed to successfully link the software. How exactly to install these packages depends on the Linux distribution used. Try first building the software without installing these libraries, and get back to this step if it turns out you need them. On a Centos 8 system that I am using, installing these libraries can be done with these commands:sudo dnf install ncurses-compat-libs.x86_64 sudo install mesa-libGL-devel.x86_64Then, the frontent can be built (make sure to have the
qmakeprogram available in the path):# Get the sources from github git clone https://github.com/stoyan-shopov/turbo # Create a directory to contain the build files mkdir turbo-build cd turbo-build qmake ../turbo/turbo.pro -spec linux-g++ CONFIG+=debug make # The built executable is named 'turbo'Important: you may need to add your user to the dialout group on Linux systems, in order to be able to open the blackmagic probes as a non-root user, for example:
sudo usermod -a -G dialout username
User interface
Let us have a look at what is seen when the freshly built frontend is run:

Because the frontend is being run for the first time, it needs some configuration to be specified. As a minimum, it is absolutely essential to specify the gdb executable that the frontend will use. This is how the configuration dialog looks like:

NOTE: It s HIGHLY recommended that you use a recent gdb version. Versions lower than 10 are poorly supported. The reason for this is that gdb version 10 and above have the ability to report program symbol information to the frontend, which is used for rapid program navigation by the frontend.
The pale grey text is a hint about what you need to specify in this dialog. It is absolutely essential to specify a valid gdb executable, the frontend will not work without one. If you intend to invoke an external editor from the frontend, for editing files, you can configure your prefered editor here as well.
NOTE: the Turbo frontend is NOT an IDE. It can NOT be used for editing files. For that purpose, you need an external editor.
Once the gdb program has been configured and successfully started, you will need to specify an executable file to debug:

If you specify a valid executable, and gdb successfully opens it, the frontend will be ready for performing debugging operations.
NOTE: The file opening dialog will keep a list of the most recently files that were loaded in the debugger. This way, switching between several projects that you are working on, is made very fast.
Once the file has been successfully loaded in the debugger, you should see the primary frontend window:

You can see that the frontend is organized as a central text view area, around which there are some views and controls. On startup, there is some brief help displayed in this area. Source code is also displayed in this area. Around the central area, there are some docking windows for displaying various information. In the picture shown, these are the Source files view, which shows all source code files that are part of the program being debugged. This tree-like view can be used for rapid navigation between files, and functions within files. The frontend supports placing bookmarks (by pressing the <F2> key), and in the picture shown the Bookmarks view is also visible. Visible is also the Object locator view - it has a pale blue background so that it is easily to visually identify. This is a powerful view, in which you can start typing a string, and you will get a list of all known program objects that match the string typed - these objects can be source code file names, functions, variables, data types. This view is used for rapidly navigating to a place of interest in the program.
NOTE: The lists of source code file names, function and variables names, and data type names are extracted by gdb from the debug information of the program being debugged, and are then reported to the frontend. This information is the only source of knowledge for the frontend to locate symbols in the program. If a symbol that you believe must be present in the program, is nonetheless not reported in the Object locator view, then this means that this symbol was not reported to the frontend by gdb. A very common example of this is a function that was inlined by the compiler. Gdb may choose to not report all such functions, even though it often could report them, based on the debug information contained in the program.
At the bottom of the picture, the Search view is visible. It contains the result of searching all known files for a given string.
NOTE: to search for a string in the program - either type it in the Search files for text field in the Search view, and press <enter>, or click with the mouse on a string in the source code while holding the <SHIFT> key. To attempt to directly navigate to a symbol definition on the program, click with the mouse on a string in the source code while holding the <CONTROL> key.
NOTE: Searching in files is currently not too useful. The reason for this is that there is no gdb command to report the list of all source code files that were processed by the compiler in order to build the final executable. This includes many of the header files that were part of the compilation. This information, in fact, does exist in the debug information contained in the executable, but there is no gdb command to request this information. It is intended to address this issue in the future. One option would be to access the DWARF debug information directly, or, perhaps much simpler, to just run an external utility (e.g., readelf, objdump) to dump the debug information, and parse the output, in order to retrieve the complete list of source code files that took part in the compilation.
Other than the data view windows, there are a number of other controls - mainly buttons and checkboxes. As there is no currently target attached, many of the buttons are disabled. It should be clear what most of the buttons do. Here is a brief description of the controls visible in the picture:

Haltbutton - halt a running targetVerify flashbutton - compare the contents of the target memory against the contents of the loaded executable file for debuggingLoad program to targetbutton - load the contents of the executable being debugged into the target memoryReset and runbutton - restart the program from the beginningContinuebutton - resume a halted tarrgetStep overbutton - execute a single step (source-code-wise), stepping over function callsStep intobutton - execute a single step (source-code-wise), stepping into function callsDisconnect gdbbutton - disconnect gdb from a remote gdb server. Maybe this button will be removed - activating it just sends adisconnectcommand to gdb.Scan and attachbutton - when a connection to a blackmagic probe is established, activating this button will send amonitor swdp_scanrequest to the blackmagic, the response will be parsed, and if a target is available, the first target will be attached. Basically, this button saves you from manually typingmonitor swdp_scan,attach 1commands directly to gdbStart gdbbutton - this button should be rarely needed. It can be used in order to start the gdb debugger, in case it exited for some reason, e.g., you typedquitin gdb, or gdb crashed
The other controls need a bit more explanation. In the toolbar, at the top of the window, there are these controls:

Show windowbutton - activating this button displays a menu which looks like this:

Here, you can conveniently see which display views are available, whether they are currently shown, and you can toggle between shown and not shown depending on your preferences
Locate windowbutton - activating this button displays a menu which looks like this:

This menu can be used for quickly locating a view window - by selecting the view of interest in this menu, this view will be made visible (in case it was not visible), and it will be visually identified by briefly flashing it. This menu can be very useful, so there is a shortcut to showing it - tab the <CTRL> key twice.
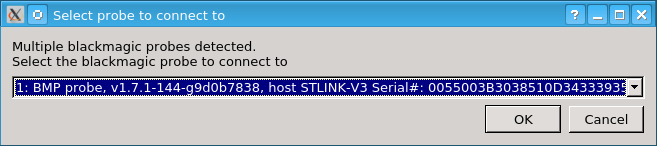
Select layout- combo box - select between a couple of preconfigured layouts for the frontend user interface. Currently, this control is not very useful, because the predefined layouts need to be constructed betterSettingsbutton - open the settings dialogHelpbutton - display brief help. This needs to be improvedGo backbutton - navigate to the previous source code location (if any) in the navigation stack, when browsing the program source code. The keyboard shortcut is<ALT> + <LEFT ARROW>Go forwardbutton - navigate to the next source code location (if any) in the navigation stack, when browsing the program source code. The keyboard shortcut is<ALT> + <RIGHT ARROW>RESTARTbutton - restart the frontend. Currently, this is the only way to request loading of a new executable file for debugging.Connect to blackmagicbutton. Activating this button will attempt to automatically detect, and connect to an available blackmagic probe. In case only one blackmagic probe is found, an attempt to connect to it is made. In case more than one blackmagic probe is found (common, when debugging the blackmagic probe with another instance of itself), a dialog to select the probe is shown:
ACTIONtool button. Activating this button displays this menu:
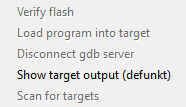
The purpose of this menu is to provide a compact list of various available actions.
There also is this set of controls in the central area:

Gdb stderrcheckbox - this has proven not to be useful, and may be removedDisassemblycheckbox - toggle theDisassemblyview (shown in screenshots below)Show gdb consolescheckbox - toggle the gdb console (shown in screenshots below). In this console, the gdb are displayed responses to commands that the user (or the frontend) issue to gdbGdb commandline edit - this control is used for directly sending commands to gdb by the user. To issue a command to gdb, type the command in this field, and press<ENTER>. The gdb response will be displayed in a gdb console view (shown in screenshots below)
This covers the basic functionality of the Turbo frontend.
Complete frontend user interface
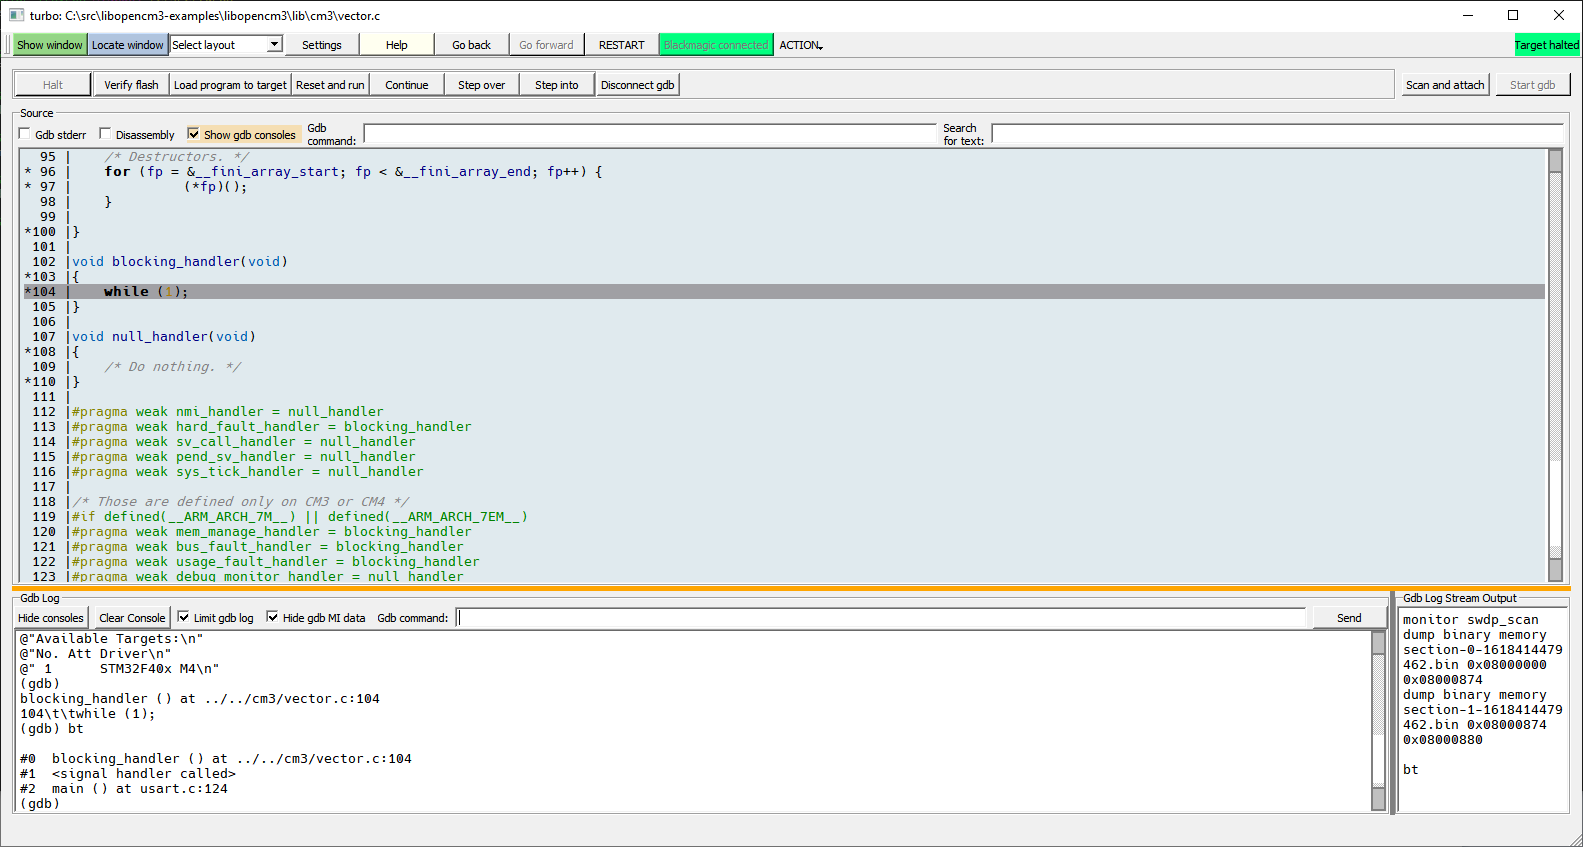
This is a minimal view of the frontend, with all views disabled. In this view, the user communicates directly with gdb, by sending commands to gdb, and observing gdb responses. The current source code location is tracked by the frontend:
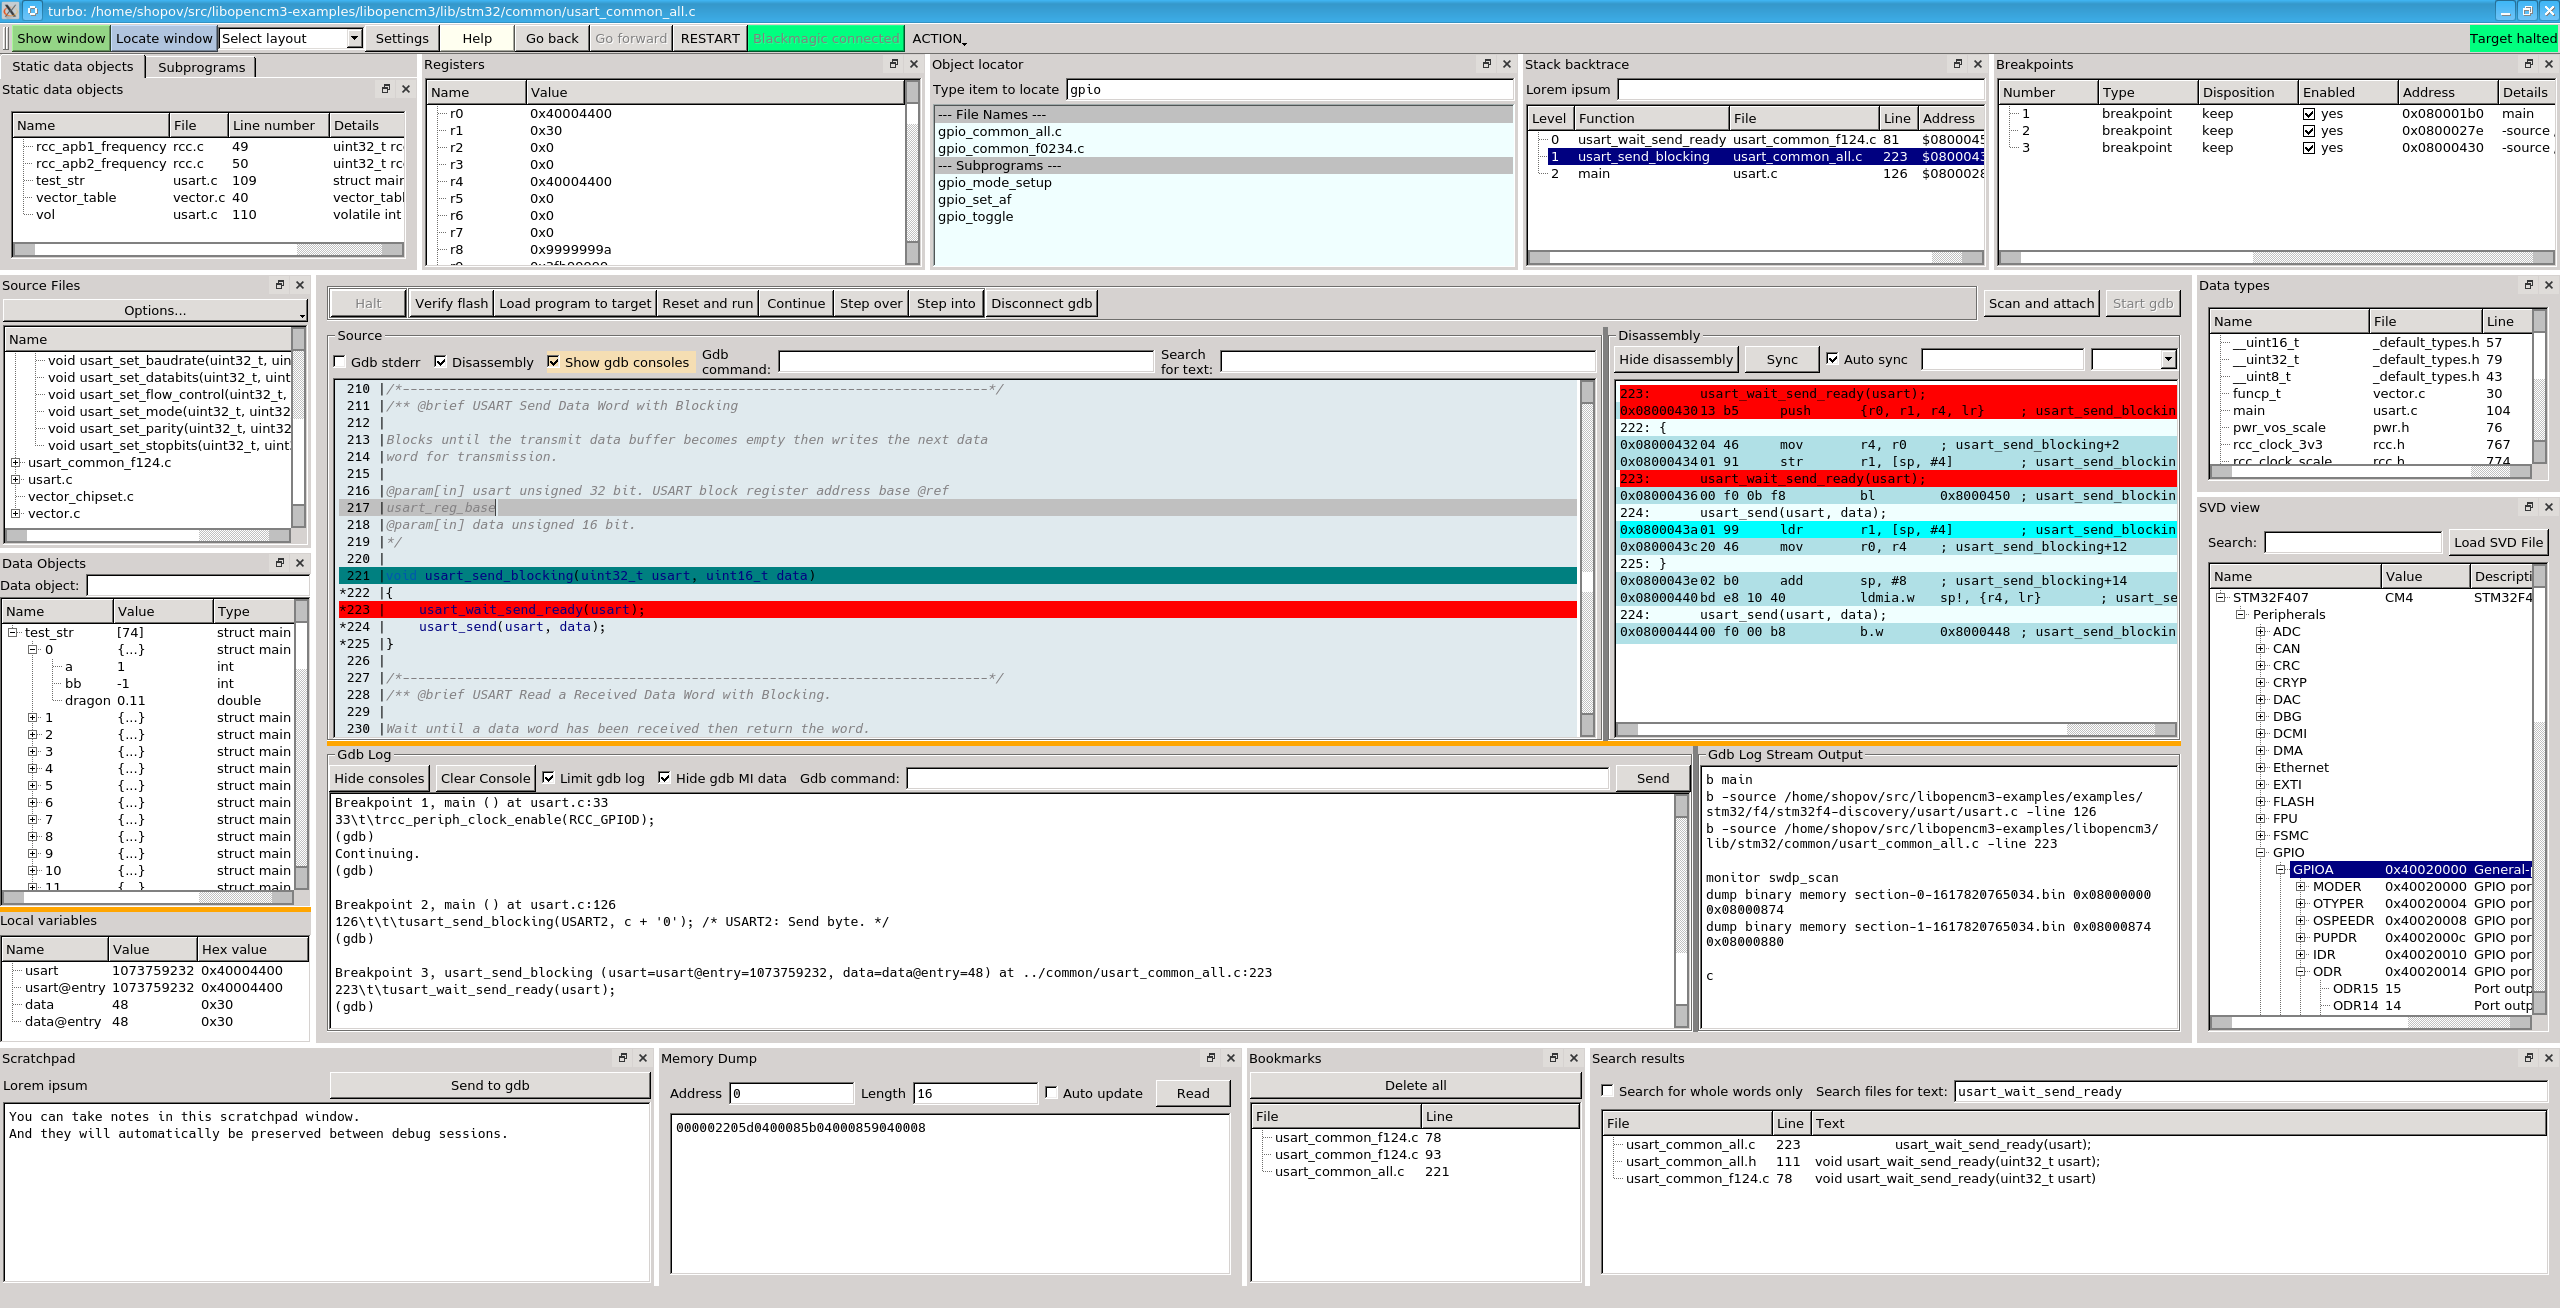
Here is a brief review of the complete frontend user interface. Please note, that the pictures below show all available views in the frontend, but, typically, when debugging, only a subset of these views will be needed, so the view is normally much less complicated and tidy, and not so confusing:
Here is an even more confusing picture, showing detached views as well:
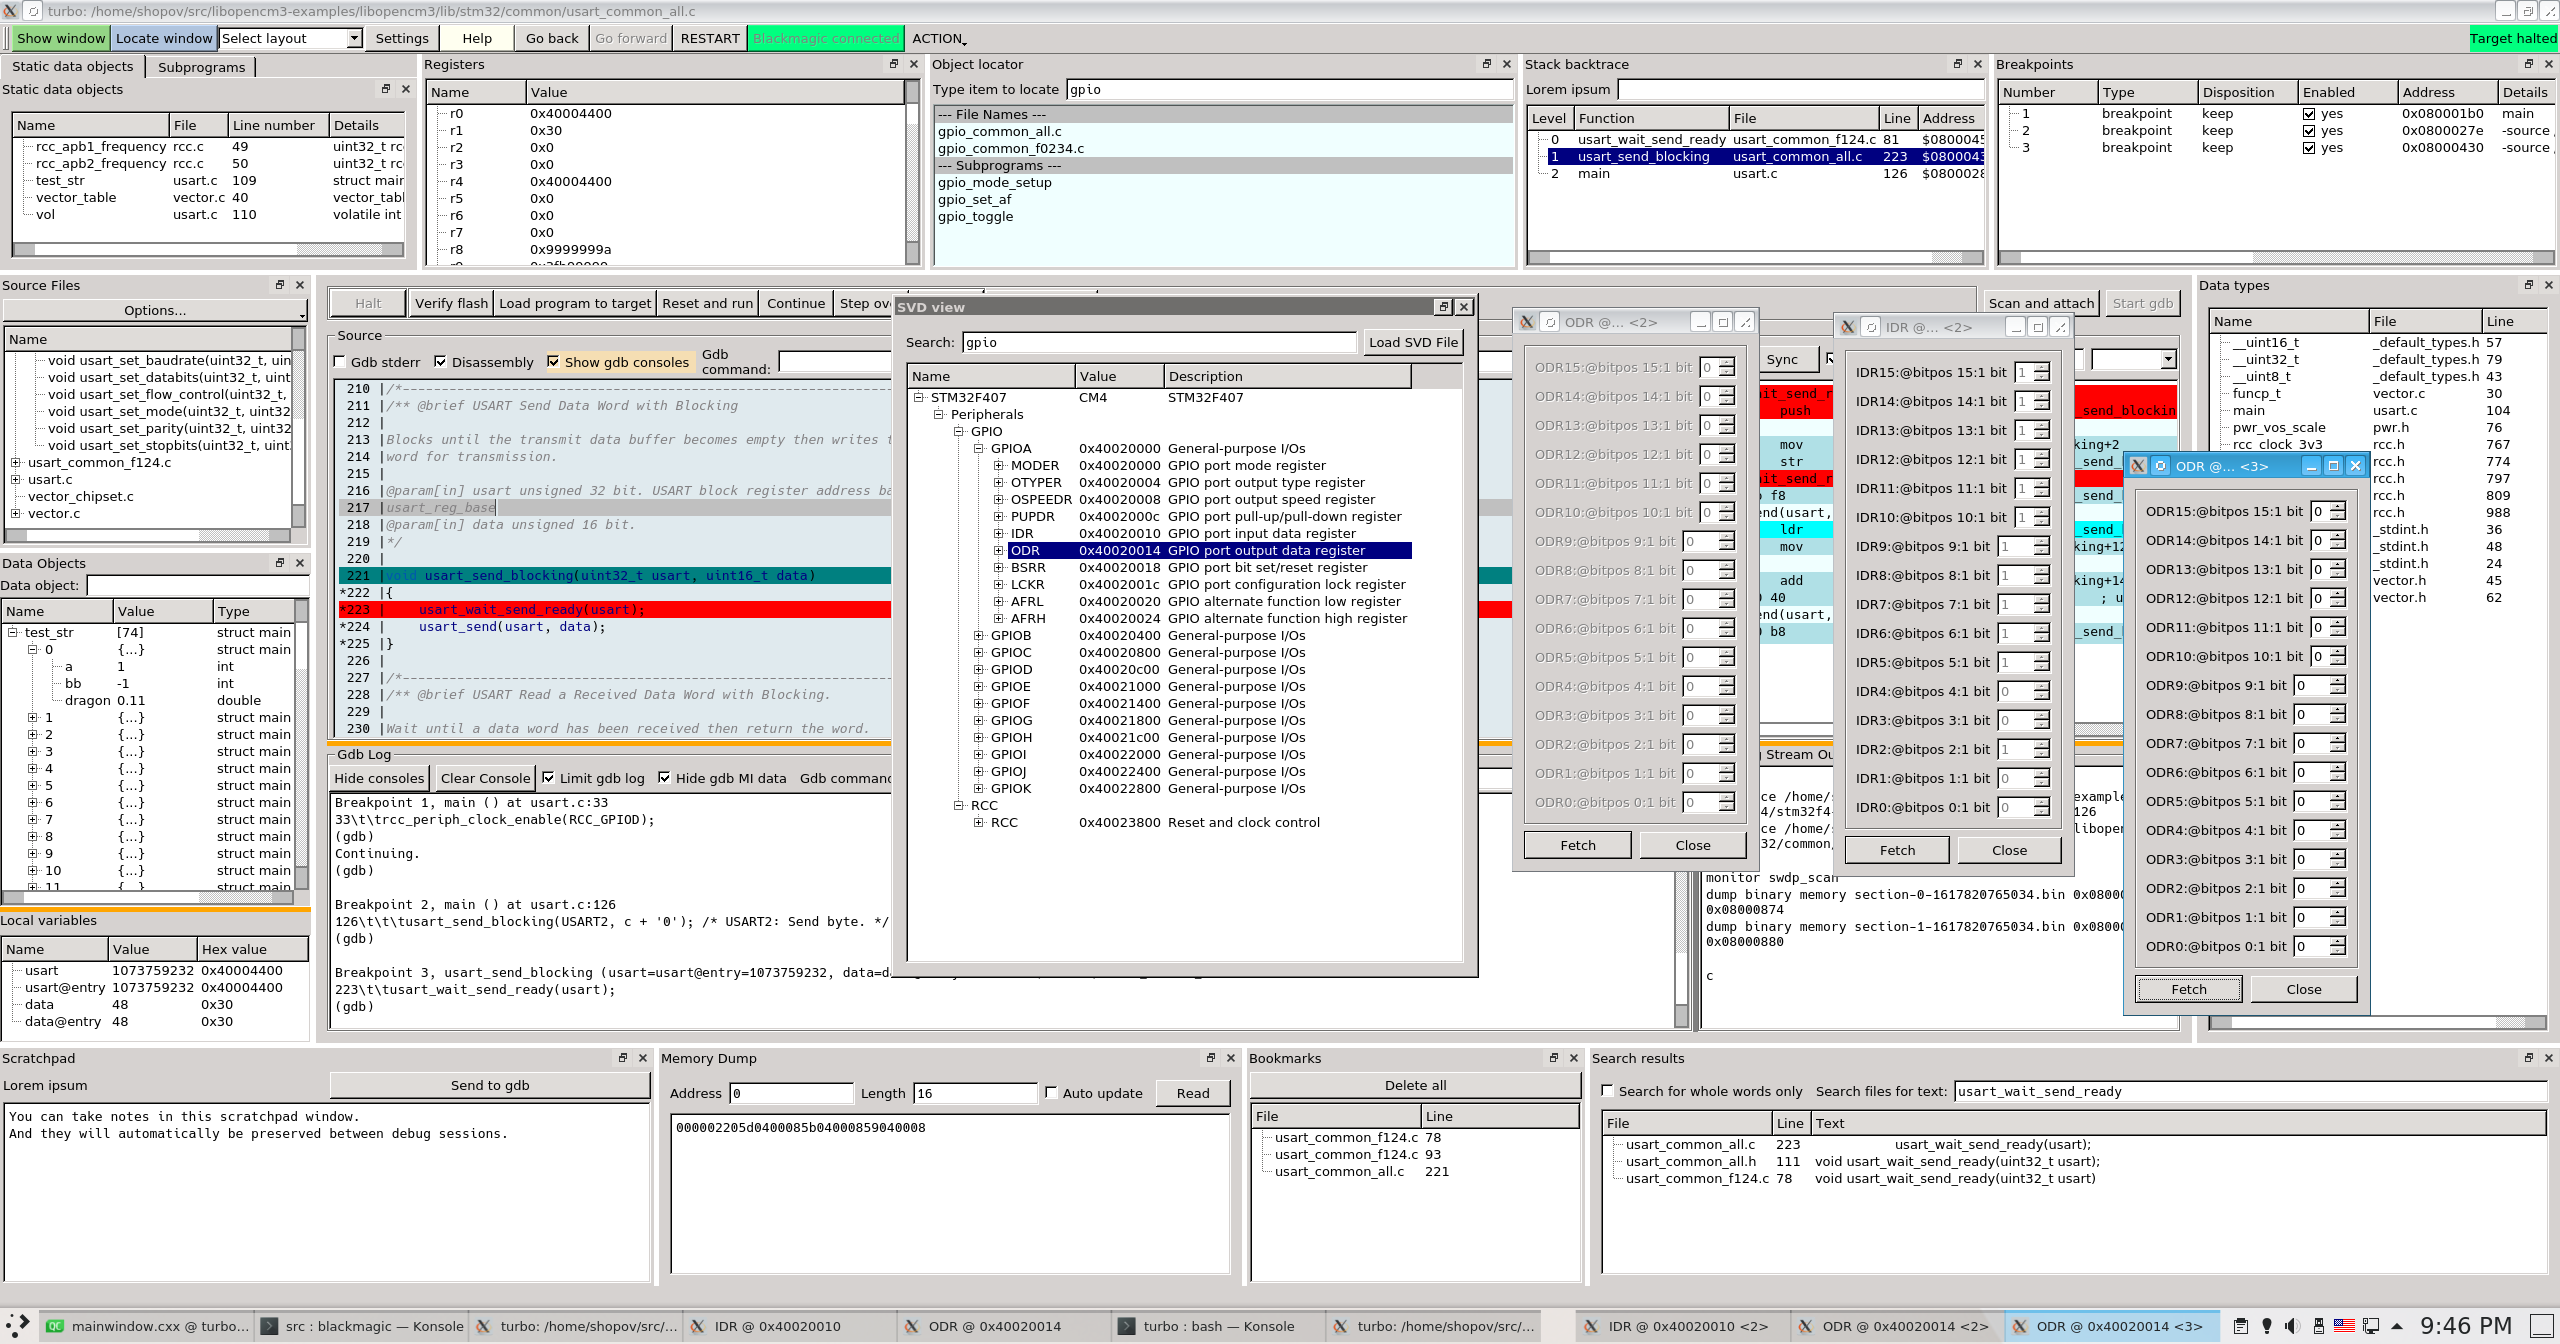
These are extreme examples, hopefully, such confusion will seldom be necessary in normal use of this program.
One of the major goals of the Turbo frontend is to allow you to compose your debugging session the way that is most convenient for you. Think of this frontend as a tailor, making a suit to fit your particular preferences. These views are shown in the picures above:
- Static data objects list (this is a misnomer, what is meant is
objects with static storage duration, in C language terminology) - Subprograms list
- Registers list
- Object locator view
- Stack backtrace view
- Breakpoints list
- Data objects view, requested by the user
- Local variables (again a misnomer, this is the list of
objects with automatic storage durationin C language terminology, i.e., stack variables) - Data types list
- System View Description (SVD), as specified by ARM, view
- Disassembly view
- Gdb console view
- Source view
- Bookmarks list
- Target memory dump view
- Scratchpad. The
scratchpadis a primitive text-holding container, where you can put notes. The scratchpad contents survive a restart of the frontend
The Qt framework used in the frontend provides powerful facilities for constructing user interfaces. It can be seen in the pictures that the particular views can be positioned in an arbitrary manner around the central source code view - they can be docked around the central view, stacked upon one another, detached from the main frontend window itself.
A view can be closed, if not needed at a particular moment. A view can be recalled, most efficiently, by tapping the <CTRL> key twice, or by triggering either one of the Show window, or Locate window buttons. Triggering the Locate window button does the same as tapping the <CTRL> key twice.
Final remarks
This small gdb frontend attempts to make debugging of small embedded targets remotely more efficient. In particular, there are some enhancements for working with the blackmagic probe.
This program is not perfect, it attempts to be useful, not perfect. Debugging can often be a kind of craft, a process of observation, experimenting, and making and verifying assumptions.
The debug experience mostly depends on the quality of the debug information provided by the compiler. In the case of the gcc and clang compilers, this is the DWARF debug information. The DWARF standard was conceived with C-like languages in mind. This explains why the C language has one of the best debugging supports available.
Unfortunately, I doubt that I will be able to allocate much time on this project in the future. I will try to address any issues, but I can make no promises. In any case, please do report any issues on the github page of this project - even if I would not be able to address them, maybe someone else could, if he or she decides to take over this project. It would be best to at least be aware of the known issues.
Thank you, and take care!