vSphere2Metrics
vSphere2Metrics is a performance metric collector for vSphere that supports Graphite and InfluxDB as its storage engine.
The main idea behind this project compared to others out there is, collect all and analyse later.
So it gathers all the available 20 second raw performance metrics of every the Hosts, VM's and VSAN that are registered in the vSphere.
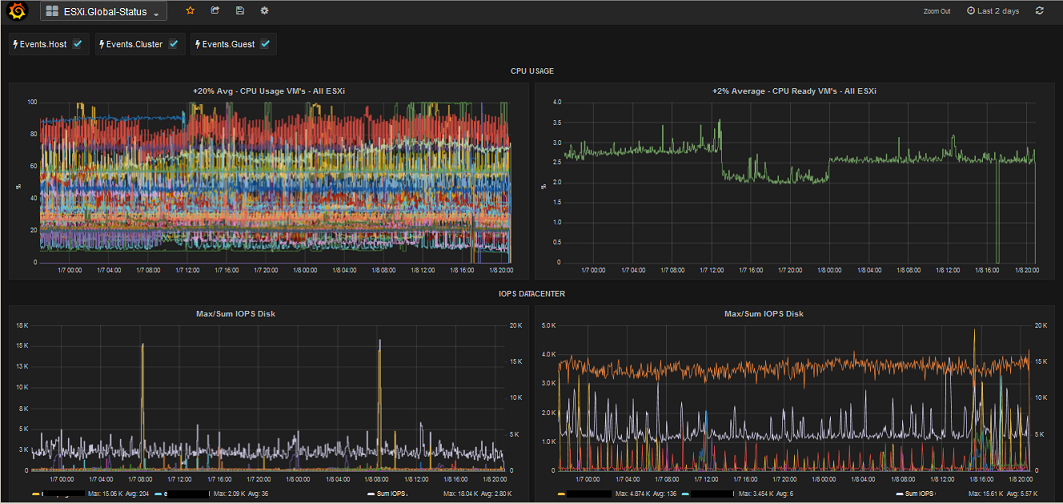
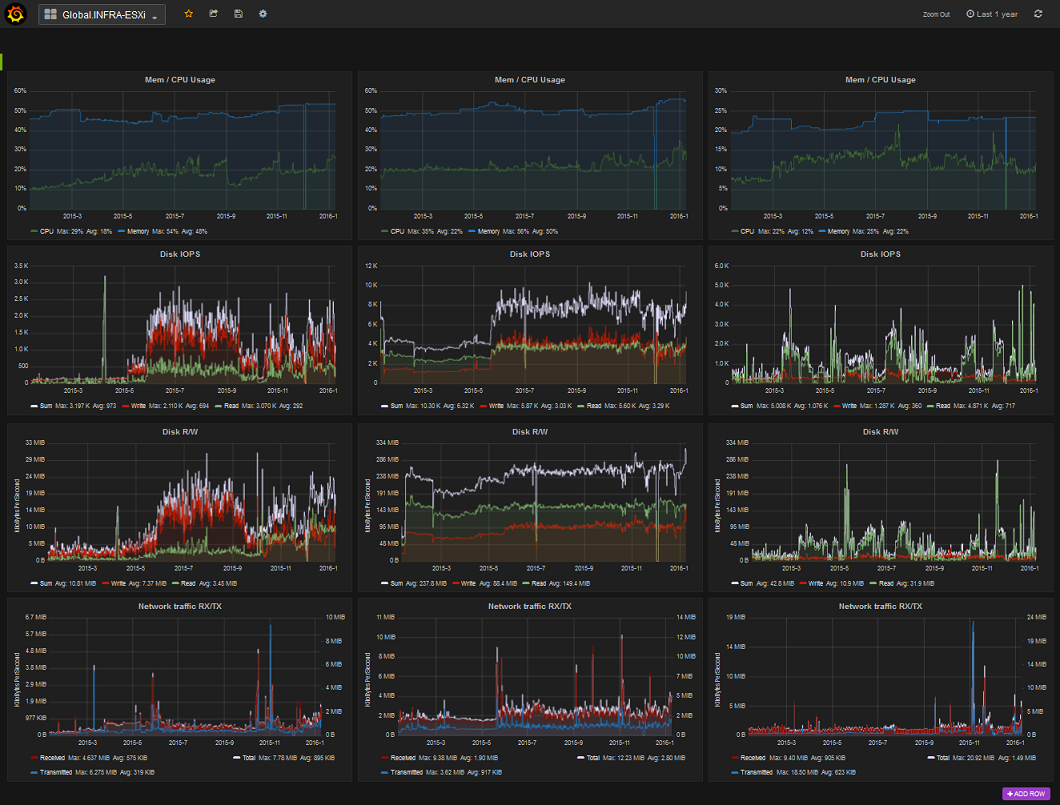
Once the metrics have been collected and stored in your preferred storage engine there is no limits to which kind of performance analytics and dashboards you can construct.
A brief overview of how vSphere2Metrics works:
- Simultaneously connects to each of the specified vSphere servers (vcs.urls)
- Gathers the events and performance metrics samples (vcs.perf_max_samples) from the last successfully collected timestamp
- Constructs the according Graphite or InfluxDB metrics
- Sends the previously built and buffered metrics using MetricClient (destination.type)
- If it fails, metrics get buffered until the next run, if not it just sleeps until the next execution (vcs.perf_max_samples)
- The process starts all over again
Features
- Connects to each vSphere concurrently (GPars)
- Collects all raw metrics from HostSystem, ResourcePool (QuickStats), VirtualMachine and VSAN Statistics
- Metrics are buffered if the storage engine is down (MetricClient)
- Supports Graphite Standard mode (UnCompressed) or Pickle (Serializing)
- Supports InfluxDB HTTP UnCompressed or Compresses Line Protocol
- Continues collection mode (daemon) or one shoot command line.
- Supports vSphere 4.x, 5.x and 6.x
Examples


Requirements
Installation and Configuration
Take a look at the vSphere2Metrics Wiki
Contribute
If you have any idea for an improvement or find a bug do not hesitate in opening an issue. And if you have the time clone this repo and submit a pull request to help improve the vSphere2Metrics project.
License
vSphere2Metrics is distributed under Apache 2.0 License.
Copyright © 2017, Sebastian YEPES F.
Used open source projects
Groovy | GPars | Logback | yavijava | MetricClient