0x.Tools: X-Ray vision for Linux systems
0x.tools is a set of open-source utilities for analyzing application performance on Linux. It has a goal of deployment simplicity and minimal dependencies, to reduce friction of systematic troubleshooting. There’s no need to upgrade the OS, install kernel modules, heavy monitoring frameworks, Java agents or databases. Some of these tools also work on over-decade-old Linux kernels, like version 2.6.18 from 18 years ago.
0x.tools allow you to measure individual thread level activity, like thread sleep states, currently executing system calls and kernel wait locations. Additionally, you can drill down into CPU usage of any thread or the system as a whole. You can be systematic in your troubleshooting - no need for guessing or genius wizard tricks with traditional system utilization stats.
xcapture-bpf and xtop v2.0.2 announced! (2024-07-03)
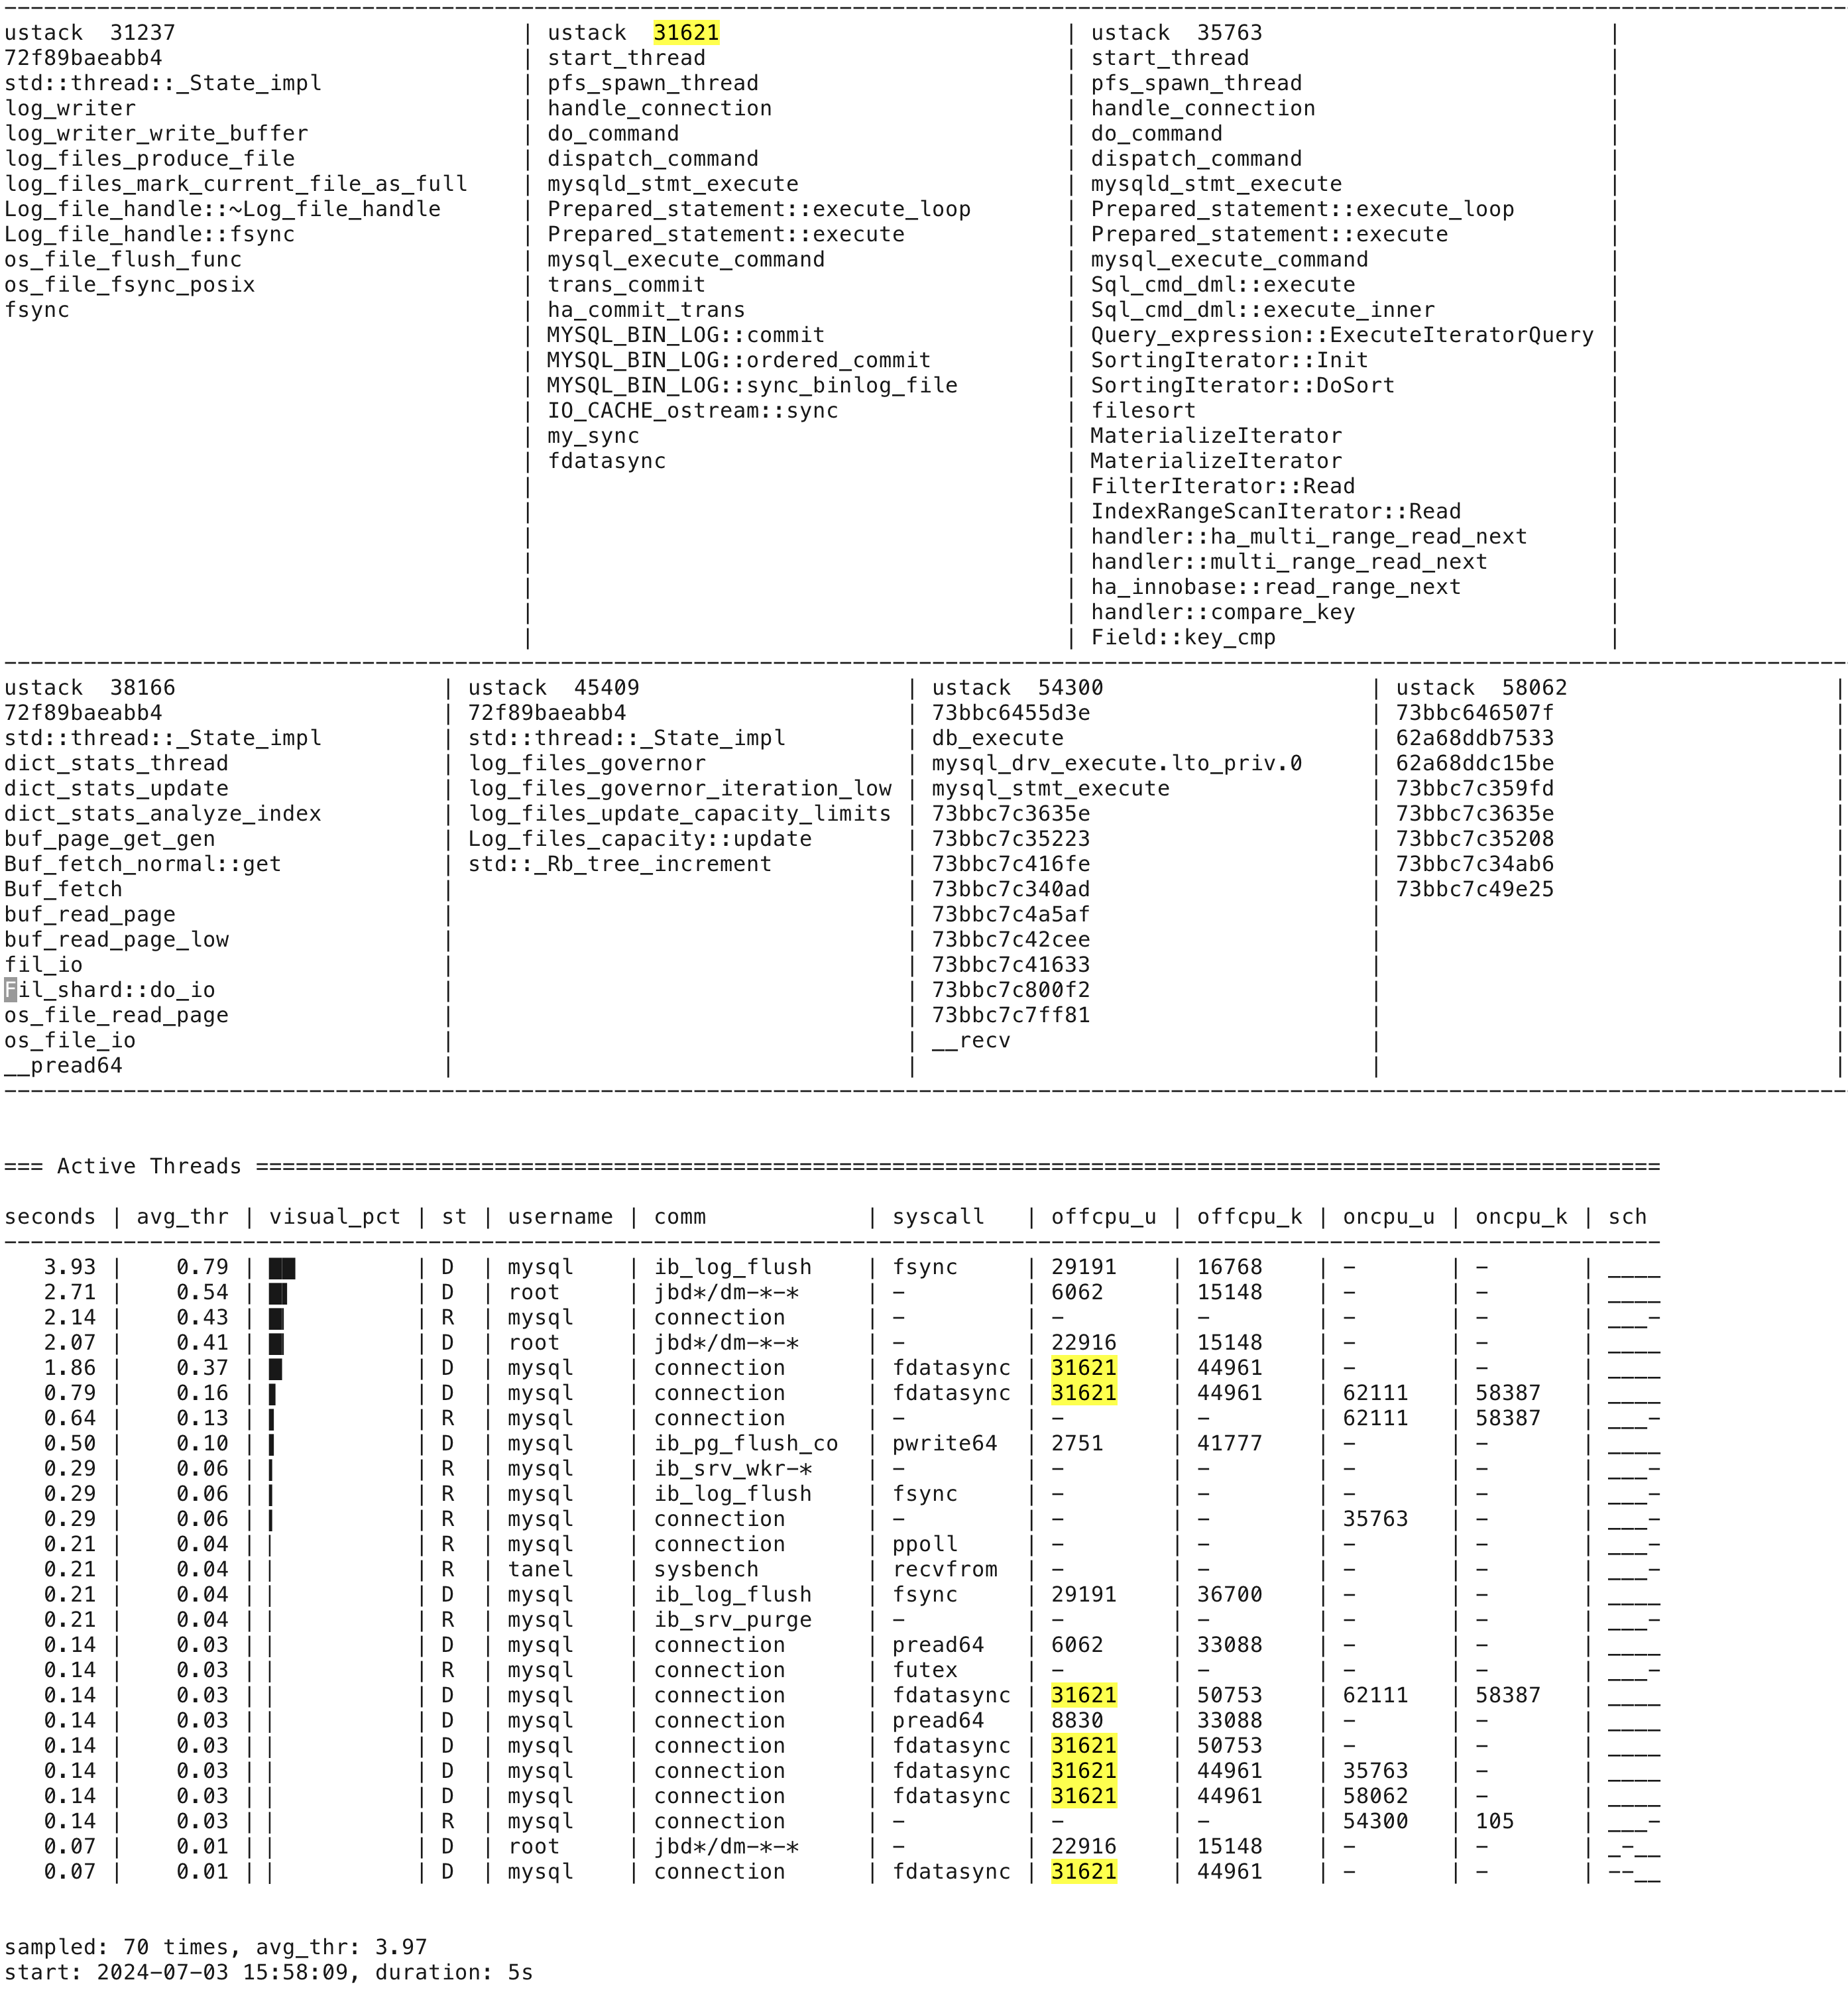
xcapture-bpf (and xtop) are like the Linux top tool, but extended with x-ray vision and ability to view your performance data from any chosen angle (that eBPF allows to instrument). You can use it for system level overview and drill down into indivual threads' activity and soon even into individual kernel events like lock waits or memory stalls. eBPF is not only customizable, it's completely programmable and I plan to take full advantage of it. I have so far implemented less than 5% of everything this method and the new tool is capable of, stay tuned for more!
xcapture-bpf demo
This is one of the things that you get:
xcapture-bpf screenshot
A screenshot that illustrates how xcapture-bpf output and stacktiles work with terminal search/highlighting and scroll-back ability:

xcapture-bpf install instructions and info
- Go to https://0x.tools for more info and the installation instructions of the latest eBPF-based tool
Other tools
An example of one of the tools psn (that doesn't use eBPF, just reads the usual /proc files) is here:
$ sudo psn -p "mysqld|kwork" -G syscall,wchan

Linux Process Snapper v0.14 by Tanel Poder [https://0x.tools]
Sampling /proc/syscall, stat, wchan for 5 seconds... finished.

=== Active Threads ========================================================================================

 samples | avg_threads | comm          | state                  | syscall   | wchan
-----------------------------------------------------------------------------------------------------------
      25 |        3.12 | (mysqld)      | Disk (Uninterruptible) | fsync     | _xfs_log_force_lsn
      16 |        2.00 | (mysqld)      | Running (ON CPU)       | [running] | 0
      14 |        1.75 | (mysqld)      | Disk (Uninterruptible) | pwrite64  | call_rwsem_down_write_failed
       8 |        1.00 | (mysqld)      | Disk (Uninterruptible) | fsync     | submit_bio_wait
       4 |        0.50 | (mysqld)      | Disk (Uninterruptible) | pread64   | io_schedule
       4 |        0.50 | (mysqld)      | Disk (Uninterruptible) | pwrite64  | io_schedule
       3 |        0.38 | (mysqld)      | Disk (Uninterruptible) | pread64   | 0
       3 |        0.38 | (mysqld)      | Running (ON CPU)       | [running] | io_schedule
       3 |        0.38 | (mysqld)      | Running (ON CPU)       | pread64   | 0
       2 |        0.25 | (mysqld)      | Disk (Uninterruptible) | [running] | 0
       1 |        0.12 | (kworker/*:*) | Running (ON CPU)       | read      | worker_thread
       1 |        0.12 | (mysqld)      | Disk (Uninterruptible) | fsync     | io_schedule
       1 |        0.12 | (mysqld)      | Disk (Uninterruptible) | futex     | call_rwsem_down_write_failed
       1 |        0.12 | (mysqld)      | Disk (Uninterruptible) | poll      | 0
       1 |        0.12 | (mysqld)      | Disk (Uninterruptible) | pwrite64  | _xfs_log_force_lsn
       1 |        0.12 | (mysqld)      | Running (ON CPU)       | fsync     | submit_bio_wait
       1 |        0.12 | (mysqld)      | Running (ON CPU)       | futex     | futex_wait_queue_me
Usage info and more details here:
Twitter:
Author: