PyPad
PyPad provides a software-independent and intuitive way to:
- Automatically & robustly determine CSPAD geometries
- Optimize detector distances and photon energies
- Generate masks interactively
- Visualize images on the CSPAD
- Gain access to the pixel coordinates of the CSPAD
Principle Authors:
TJ Lane || tjlane@stanford.edu || Doniach Group
Jonas Sellberg || sellberg@slac.stanford.edu || Nilsson Group
PyPad is currently v0.0.1, and is undergoing testing.
Install
Installation should be as easy as downloading this package and running:
python setup.py install
This will automatically install the API in your python distribution and put the scripts in your path. PyPad depends on the following python packages:
- numpy
- scipy
- matplotlib
- pyyaml
- h5py
Help
There are three sources of documentation for PyPad:
- This README
- The PyPad API is documented in-place in the code
- You can also pass -h to the scripts to get some help
Tutorial: Geometry Optimization
Below, We'll go through a quick example of how to use the autogeom scripts, and demonstrate their function via a relevant example: shifting the CSPAD quadrants to gain an optimal geometry. For this example we'll use an averaged run from an experiment done on gold nanoparticles at CXI. This file is provided in examples/gold-minus490mm.h5 in HDF5 format.
Note: before you begin with any geometry optimization, you need a good calibration sample. A good sample has thin, bright rings -- the more rings, the better. Obtaining images of this sample at multiple detector positions is recommended.
(1) Generate a filter that will remove experimental noise.
To begin, let's interactively set up the parameters for the optimization algorithm. Load an image to optimize and the optical metrology (provided by LCLS) with the following command:
prepgeom -m examples/ds1_jun2011_opticalmetrology.txt examples/gold-minus490mm.h5
You'll get an interactive window with something that looks like this:
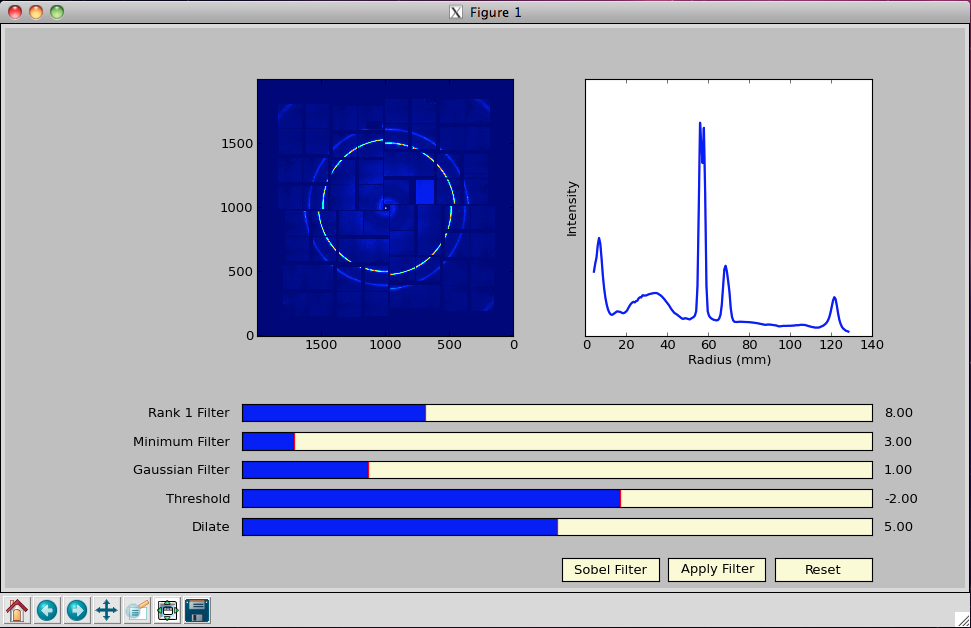
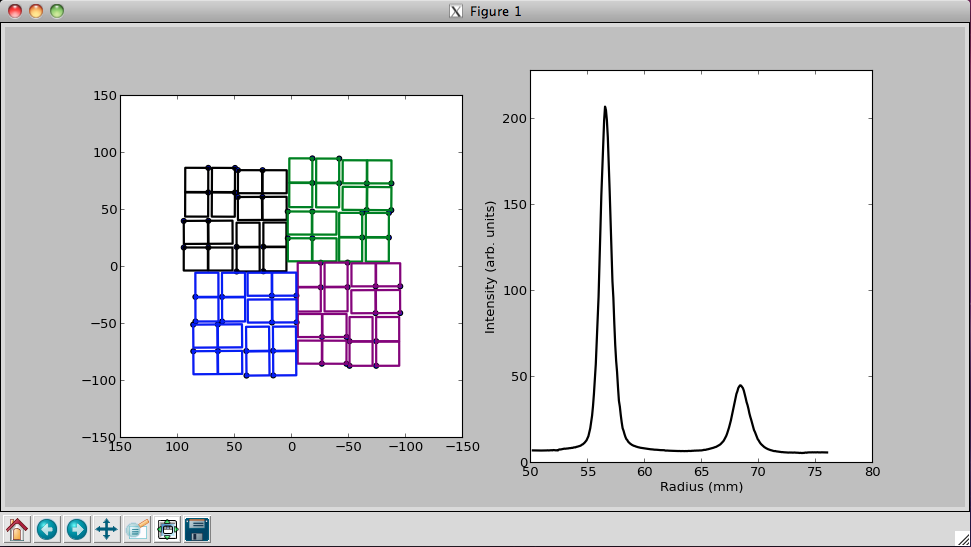
Follow the instructions that get printed to screen. First, change the dilation so the quadrants align in the 2D image and the peaks look sharp in the radial projection to the right. If you want, you can then press the Apply Filter button and change the threshold and filters to obtain a good contrast in the 2D image. (For the gold example, the filters seems to give a slightly worse geometry optimization, but this may depend heavily on the data that is optimized.) Last, select one or several regions, which include one or several powder rings each. This is demonstrated in the example below, where we've selected the two brightest rings (Miller indices (111) and (200)) for these gold nanoparticles:

(2) Optimize the geometry.
Once you've closed the prepgeom script and generated the filter_params.yaml, which include the optimized filter settings, you're ready to run:
optgeom examples/gold-minus490mm.h5 filter_params.yaml -m examples/ds1_jun2011_opticalmetrology.txt
which will look something like this:
If the script is rejecting a bunch of moves initially, don't worry about it. Eventually it will narrow down the steps which will stop causing the ASIC overlaps. If plotting each iteration is slow on your computer, you can turn it off by adding the flag plot_each_iteration: False to filter_params.yaml.
(3) Score your optimized geometry.
This is where multiple images taken at different detector distances come in handy. You need to prepare a simple params file, like the one in examples/score_params.yaml, telling the script what Miller indices (i.e. Bragg reflections) you expect in your sample, and where the images to include in the scoring are located. Try run:
score examples/score_params.yaml
yielding

You can switch between the images taken at different detector distances by pressing n or l, as explained by the script. The script will output the residuals for each peak included in the fit as well as the optimized sample-detector distance offset w.r.t. the recorded motor positions. If the flag opt_energy is set to True in examples/score_params.yaml, the script will also optimize the photon energy at which the images were recorded.
(4) Take a look at the result.
Run:
assemble examples/gold-minus490mm.h5 --metrology my_cspad.cspad
You should get something like this:
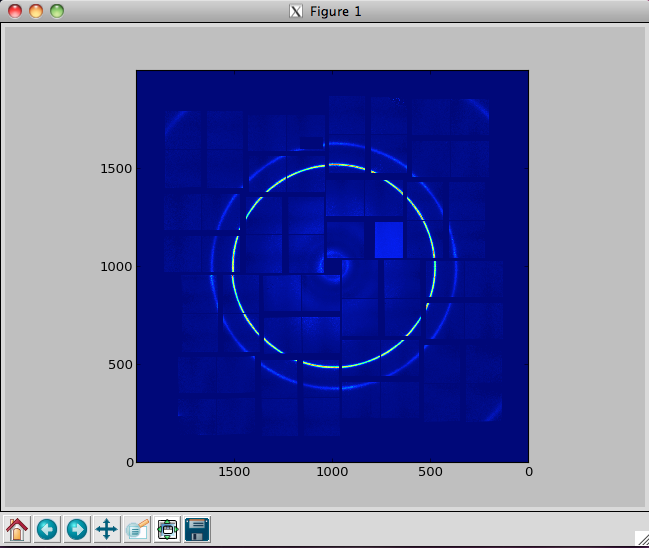
It may vary slightly depending on the parameters you used. You can plot the position where the forward beam intersects the detector plane by running:
assemble examples/gold-minus490mm.h5 --metrology my_cspad.cspad --center
(5) Export the parameters to your front-end of choice.
Check out the geomconv script, which is pretty self-explanatory. Contact us if you want help implementing a conversion for your favorite representation!
Tutorial: Mask Generation
PyPad also provides an interactive masking environment, which you can easily use to create pixel masks. Often, certain pixels on the CSPAD give anomalous responses or are completely fried, and you don't want to include those in your data analysis.
To generate a mask, use the genmask script and follow the instructions printed to your terminal. You'll get a pop up window that looks something like this:

which you can click on to create you mask.
Contribute
If you would like to add to PyPad or suggest an enhancement, please do! The usual GitHub features (issues & pull requests) should suffice for these purposes.