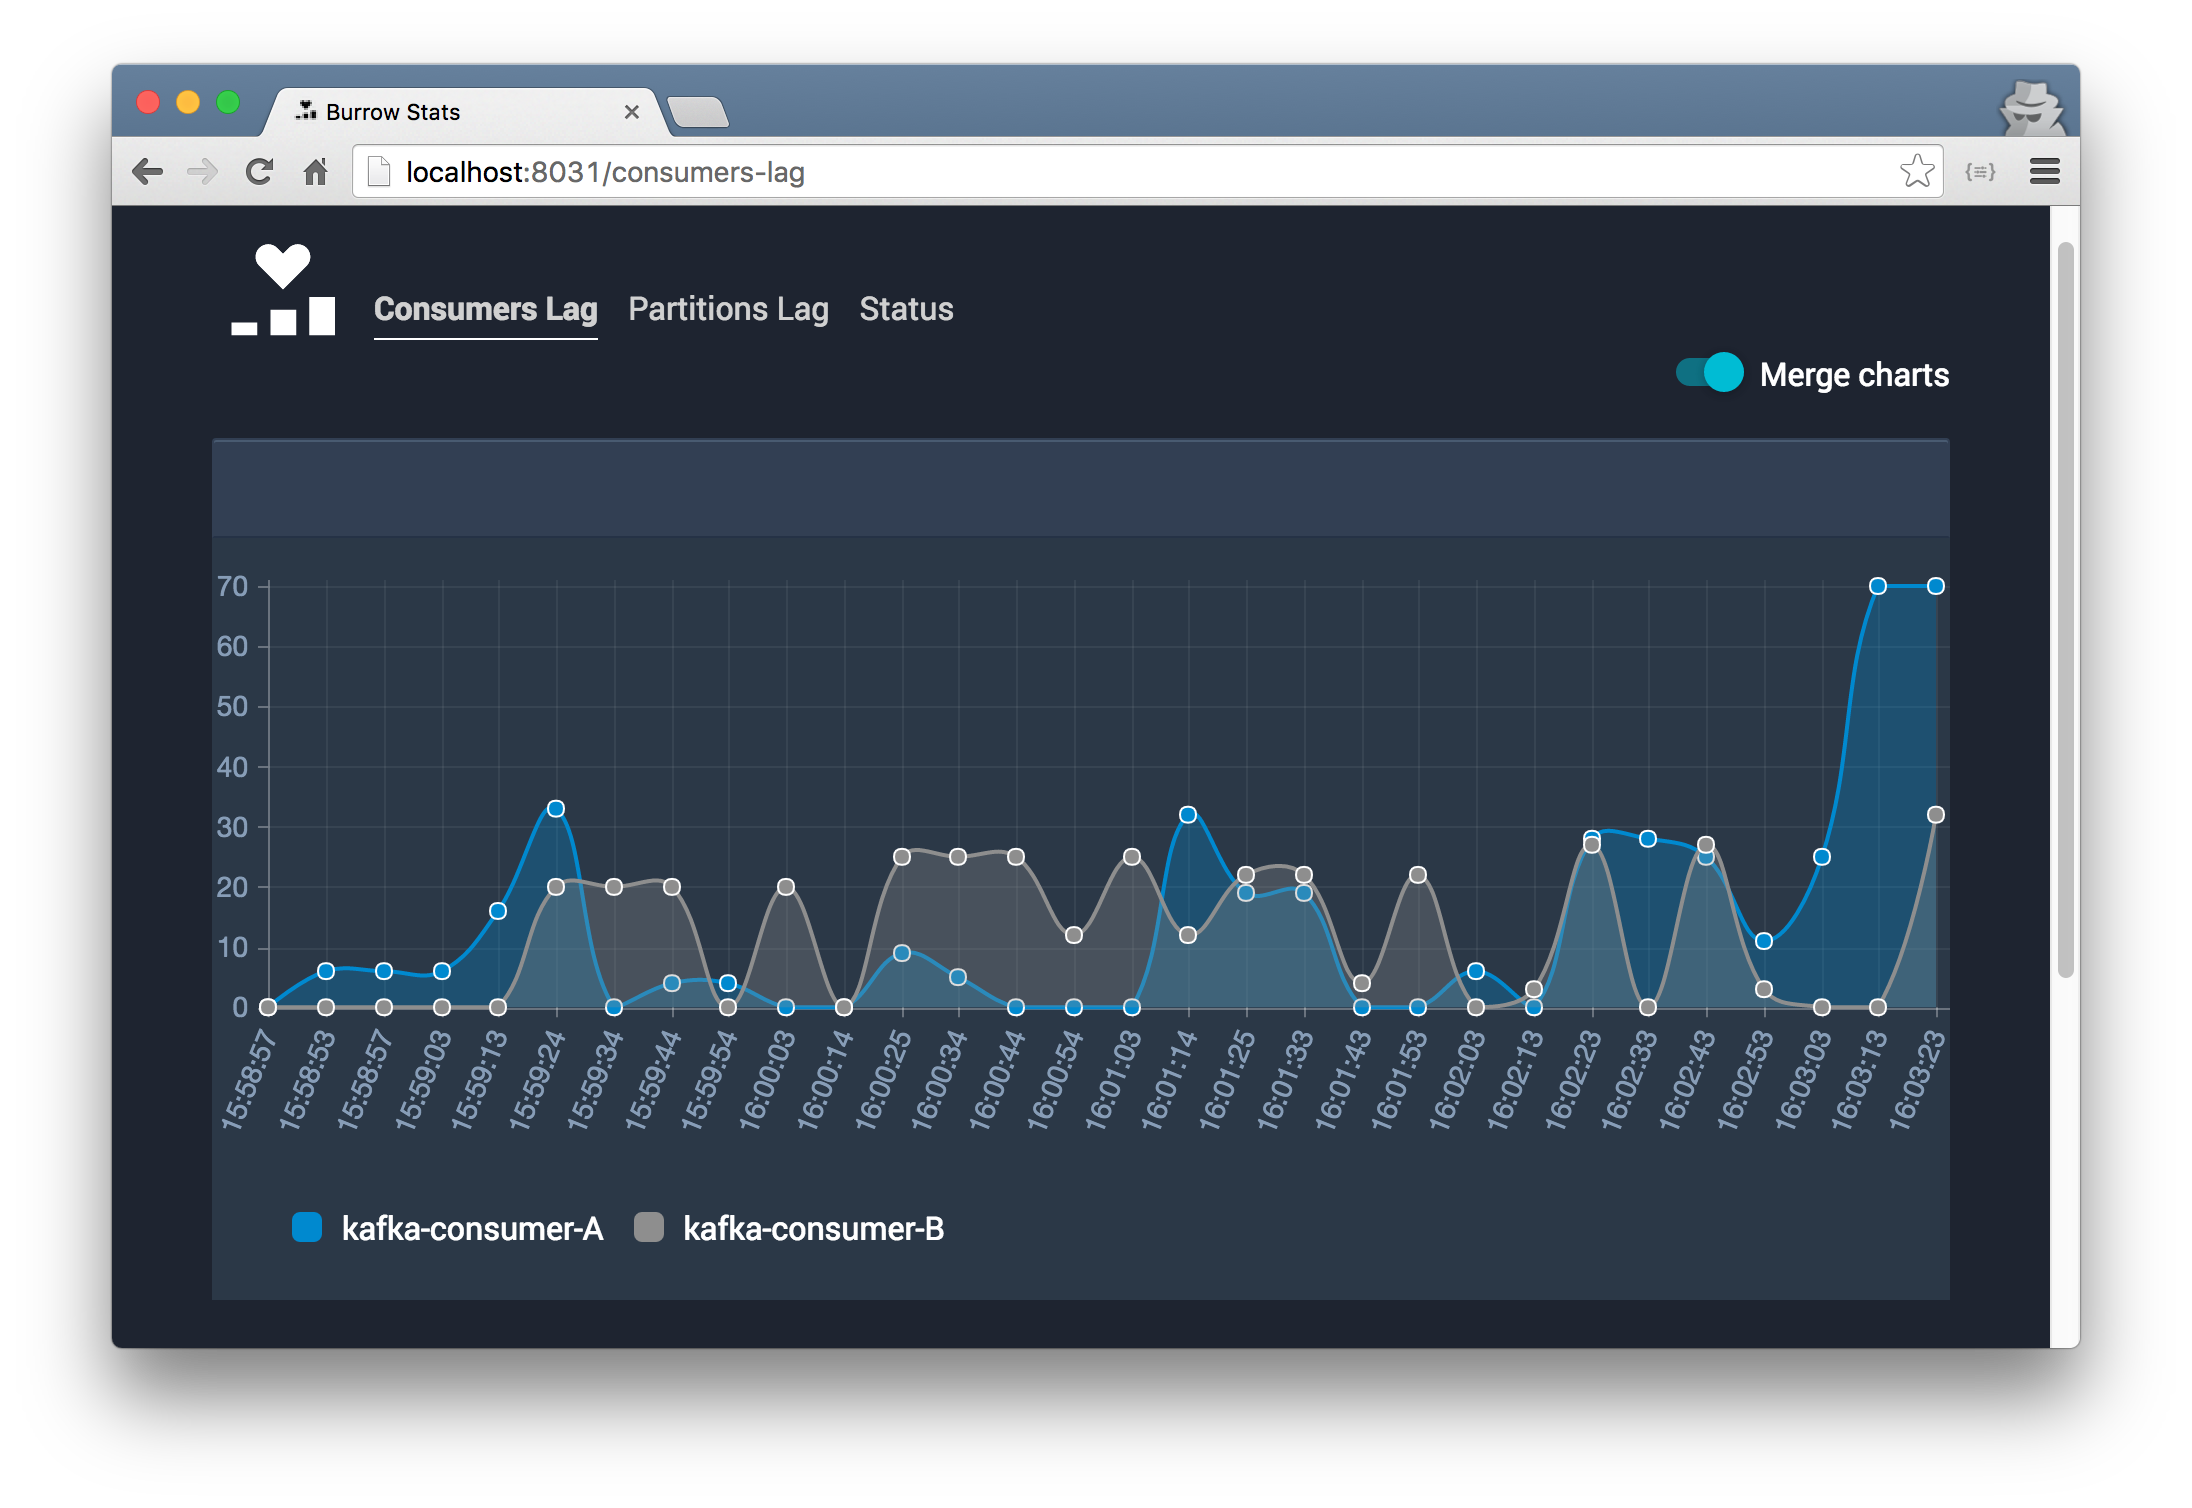
Burrow Stats
Dashboard for burrow kafka consumer lag checking
Running locally
yarn install

npm run dev- Remember to create the config file (
configs.json)
Production
NODE_ENV=production npm run build
NODE_ENV=production npm start
Docker
docker run \
  -p 8022:8022 \
  -e PORT=8022 \
  -v /path/to/your/configs.json:/opt/burrow-stats/configs.json \
  tulios/burrow-stats:latest
Configs
Burrow-stats requires a configuration file called configs.json. Take a look at configs.json.example for a complete example.
1) Consumers
{
  "consumers": [
    {
      "name": "consumer_name_1",
      "status": "http://burrow-host:8000/v2/kafka/cluster_name/consumer/consumer_name_1/status",
      "consumer_group_offset": "http://burrow-host:8000/v2/kafka/cluster_name/consumer/consumer_name_1/topic/topic_name_1",
      "topic_offset": "http://burrow-host:8000/v2/kafka/cluster_name/topic/topic_name_1"
    }
  ]
}
Accepts configurations for your consumers, if needed can aggregate data from different burrow instances.
2) Chart Options
{
  "chartOptions": {
    "scaleOverride": false,
    "scaleSteps": null,
    "scaleStepWidth": null,
    "scaleStartValue": null,
    "scaleFontSize": 14
  }
}
Allows you to change some behavior of the chart.
- scaleOverride : Enable scale override with a hard coded values. Default
false - scaleSteps : The number of steps in a hard coded scale (Requires
scaleOverridetrue) - scaleStepWidth : The value jump in the hard coded scale (Requires
scaleOverridetrue) - scaleStartValue : The scale starting value (Requires
scaleOverridetrue) - scaleFontSize : Scale label font size in pixels. Default
14
Example using hard coded values for scale. The Y axis will start with 0 and it will contain 20 steps of 10. All scale parameters are connected, you must provide all of them when enabling scaleOverride.
{
  "scaleOverride": true,
  "scaleSteps": 20,
  "scaleStepWidth": 10,
  "scaleStartValue": 0
}
3) Burrow Stats Options
{
  "burrowStatsOptions": {
    "pollInterval": 60,
    "cacheBinSize": 30,
    "envLabel": "Staging",
    "envLabelColor": "white",
    "envLabelBgColor": "rgba(0, 137, 207, 1)"
  }
}
Configure burrow-stats internals.
- pollInterval : Frequency of data update in seconds. Default
60 - cacheBinSize : Number of data points stored. Default
30 - envLabel : Optional environment label. Default
null

- envLabelColor: Default
white - envLabelBgColor: Default
rgba(0, 137, 207, 1)