


E5 URoL physiology timeseries project
Abstract
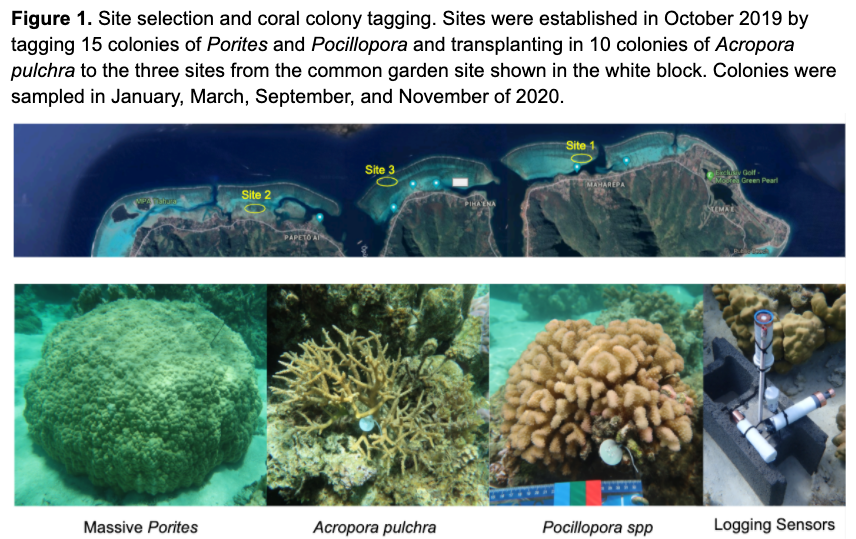
Seasonal environmental variation drives host and symbiont physiological state of three important reef-building coral species in Moorea, French Polynesia
Seasonal cycles in marine ecosystems generate fluctuations in important environmental factors key to triggering or driving life history states (i.e., gametogenesis, spawning, flowering, migration, etc.). Importantly, the seasonally driven change in environmental conditions influences the energetic and, therefore, physiological state of an organism, which is critical to its capacity to respond to environmental stress and perturbations. For reef-building corals, the nutritional symbiosis of the cnidarian host with intracellular single celled dinoflagellates in the Family Symbiodiniaceae, results in a combined responsiveness to fluctuations in temperature, light, and nutrients, all of which change seasonally in tropical oceans. Deviations in these three factors outside of normal ranges are major drivers of dysbiosis of the coral-Symbiodiniaceae relationship that can result in coral bleaching and mass mortality. However, many studies of the effects of these variables take place in the absence of a consideration of the current physiological state of the coral holobiont due to seasonal timing. Here, we used the well-described site of Moorea, French Polynesia to test the effect of seasonal variation from environmentally distinct sites on three dominant and ecologically important genera, Acropora, Pocillopora, and Porites. We collected samples from coral colonies in January, March, September, and November of 2020 and quantified a suite of physiological variables (13 characteristics measured) in the coral host and algal symbiont, as well as molecular identification of the Symbiodiniaceae community and host species. Physiology of the three genera differed significantly. Within each genus, variance partitioning analyses identified seasonal timepoint as the dominant explanatory factor, with a lesser influence of site. Porites showed the highest level of variance explained by site due to variability in symbiont population growth and biomass. Seasonal time point was the major driver of shifts in holobiont energetic state, characterized by strong shifts in tissue biomass, host protein, and symbiont photosynthesis and biomass characteristics, with site-specific physiological optimization in each genus. Despite Porites hosting high fidelity symbionts, we observed the strongest seasonal acclimation of the symbiont population physiology compared to that in Acropora (stable symbiont populations) and Pocillopora (exhibiting the highest diversity in symbiont populations). These data provide an essential picture of the need for considering physiological state and its seasonality, particularly considering the plethora of climate change related stress test assays taking place throughout the year.
Experimental Design
Navigating this repository
This repository is organized such that each sampling time point (1 = January 2020, 2 = March 2020, 3 = September 2020, 4 = November 2020) has a dedicated folder with all metadata, data files, and scripts necessary for calculating physiological responses. All data output in these individual time points is then read in, assembled, and analyzed in the time_series_analysis directory.
Contents
-
- This folder contains metadata files that were generated during the study. If you are looking for final and corrected colony ID's or metadata, DO NOT use these files. See the "Looking for colony metadata" section below.
-
- This folder contains
scripts,data, andoutputfor physiological responses collected in January 2020. The scripts in this folder read in raw data files and conduct normalization and calculations for each response. Calculated responses are output in theoutputfolder and analyzed as described in thetime_series_analysisfolder. Open this project with thetimepoint_1.Rprojfile.
- This folder contains
-
- This folder contains
scripts,data, andoutputfor physiological responses collected in March 2020. The scripts in this folder read in raw data files and conduct normalization and calculations for each response. Calculated responses are output in theoutputfolder and analyzed as described in thetime_series_analysisfolder. Open this project with thetimepoint_2.Rprojfile.
- This folder contains
-
- This folder contains
scripts,data, andoutputfor physiological responses collected in September 2020. The scripts in this folder read in raw data files and conduct normalization and calculations for each response. Calculated responses are output in theoutputfolder and analyzed as described in thetime_series_analysisfolder. Open this project with thetimepoint_3.Rprojfile.
- This folder contains
-
- This folder contains
scripts,data, andoutputfor physiological responses collected in November 2020. The scripts in this folder read in raw data files and conduct normalization and calculations for each response. Calculated responses are output in theoutputfolder and analyzed as described in thetime_series_analysisfolder. Open this project with thetimepoint_4.Rprojfile.
- This folder contains
-
- This folder contains raw data files from Symportal analysis of ITS2 sequences. Data are analyzed in the
time_series_analysisfolder described below.
- This folder contains raw data files from Symportal analysis of ITS2 sequences. Data are analyzed in the
-
-
Open this project with the
time_series_analysis.Rprojfile. This directory contains scripts, aFiguresdirectory, and aOutputdirectory and subfolders within these for each data type. -
- This script analyzes ITS2 sequence data produced through the SymPortal workflow. Output figures are stored in the Figures/ITS2 folder.
-
environmental_data_analyses.Rmd- This script analyzes available temperature, light, pH, and salinity data. Figures and summary data are stored in the Figures/Environmental folder and Output folder.
-
- This script reads in all data files for each physiological response from each individual time point and assembles the data into one master dataframe. This script corrects colony ID errors, and QC's data, calculates different normalizations for each metric, and subsets data for other analyses. Master data frame is stored in the Output directory.
-
- This script plots univariate response metrics for all physiological variables across site and time and species. Each response is analyzed using linear mixed effect models accounting for repeated measures. Figures are stored in the Figures/Univariate folder and summaries of data are stored in the Output directory.
-
- This script generates PCA plots and conducts PERMANOVA analyses of multivariate physiology by species. PCA's were also generated for each species for responses normalized to each possible normalizer (surface area, protein, and biomass). Figures are stored in the Figures/NormalizerPCA folder
-
- This script generates PCA plots with trajectory arrows to track change in group centroid between sites and across seasons. This script generates biplot loadings for these plots and conducts PERMANOVA analyses. Figures are stored in the Figures/Multivariate folder.
-
5_plasticity_analysis_travel_distance.Rmd- This scripts calculates a "plasticity" metric that is the total "distance" that species trajectories travel across time from plots generated in script 4. Figures are stored in the Figures/Plasticity folder. Note that this analysis is kept in the repository but is not used in further analysis or presented in the publication. We instead pursued variance partitioning analyses as described below.
-
- This script conducts preliminary linear model selection analyses to analyze the relationships between physiological metrics and a phenotype-level response (calcification).
-
- This script conducts variance partitioning and redundancy analyses (RDA) on physiological metrics. Figures are stored in the Figures/Multivariate folder.
-
8_plasticity_analysis_centroid_distances.Rmd- This script also conducts an analysis to generate a "plasticity" metric calculated as the distance between group centroids. Figures are stored in the Figures/Multivariate folder. Note that this analysis is not used in further analyses or presented in the publication. We instead used variance partitioning analyses.
-
9_multivariate_analysis_betadispersion.Rmd- This scripts conducts multivariate analyses of betadispersion.
-
- This script conducts distance-based redundancy analyses (dbRDA) to investigate the relationships between symbiont community composition and physiological responses. Figures are stored in the Figures/ITS2 folder.
-
Responses measured
We measured the following physiological responses:
Running scripts
To run .Rmd scripts, set Knit directory to "Project Directory" prior to running full scripts. Restart your R environment prior to running scripts.
To run all data from start to finish or re run all multivariate and univariate analyses after revising individual time point analyses:
-
Open the R project for the time points individually (e.g.,
timepoint_1.Rprojwithin each time point folder). Run all scripts in thescriptsfolders in individual time point folders. First run thesurface_area.Rmdand then theprotein.Rmdto generate output for normalizers needed in other data sets. Note that output of calculated metrics will be stored in theoutputfolder within each time opint with the timepoint number in the file name:1_surface_area.csv. Run these scripts for all four time points in turn (timepoint 1, 2, 3, and 4). -
Open the
time_series_analysis.Rprojproject in the time series analysis folder. This project contains all scripts to read in data from each time point, conduct QC and metadata merging, and perform univariate and multivariate analyses. Run the scripts in this project in the numerical order they are named (e.g.,1_assemble_data.Rmdthen2_univariate_analyses.Rmd.
If you are looking to run individual steps of the analysis without changing any inputs, you can open and run scripts at any point in the workflow.
Looking for colony metadata?
QC'd colony metadata is available in the time series analysis repository here. It is critical to use this file for colony metadata. Colony metadata in individual time point folders includes errors and typos that are corrected in the time series analysis.
Use the colony_id_corr column for the corrected colony_id.
Data standards
-
'site' (site where sample was collected)
- 'site1' = Manava
- 'site2' = Mahana
- 'site3' = Hilton
-
'lon' (longitude coordinate)
- Use decimal degrees: dd.ddddd°
-
'lat' (latitude coordinate)
- Use decimal degrees: dd.ddddd°
-
'date'
- Use format: YYYYMMDD
-
'time'
- Use format: hh:mm with 24-hour clock
-
'species'. (species of coral sampled)
- 'POC' = Pocillopora
- 'POR' = Porites
- 'ACR' = Acropora
-
'colony_id' (coral tag number)
- Always include species and number separated by a dash, e.g. 'POC-201'
Contact
If you have any questions, contact Ariana Huffmyer at ashuffmyer (at) uri.edu.