Vertica Grafana Data Source Plugin
Vertica Grafana data source plugin allows you to query and visualize data from a Vertica database. This plugin supports features such as SSL and Native Load Balancing. This version of the plugin is updated from Angular to React framework and is a signed plugin.
To modify and build your own version of the plugin, refer to the Setting Up Your Development Environment section in this readme.
Migrating from an Older Version of the Data Source Plugin
• If you have an older version of the plugin with the same ID as vertica-grafana-datasource, remove the older version using grafana-cli and replace it with the new version:
grafana-cli plugins remove vertica-grafana-datasource
Your old dashboards will work as expected after you install the new version of the plugin.
• If your plugin ID does not match with vertica-grafana-datasource
- Export your existing dashboards.
- Remove the old dashboards.
- Install and configure the new plugin.
- Import your dashboards and change the embedded data source.
Installing the Grafana Data Source Plugin
To install the plugin, see the Installation tab in the Grafana Plugins page for Vertica.
Adding a Data Source
To add a data source in Grafana, refer to Data Sources > Add data source in the Grafana Documentation website.
Note: Only users with the admin role can add data sources.
Configuring the Vertica Grafana Data Source Plugin
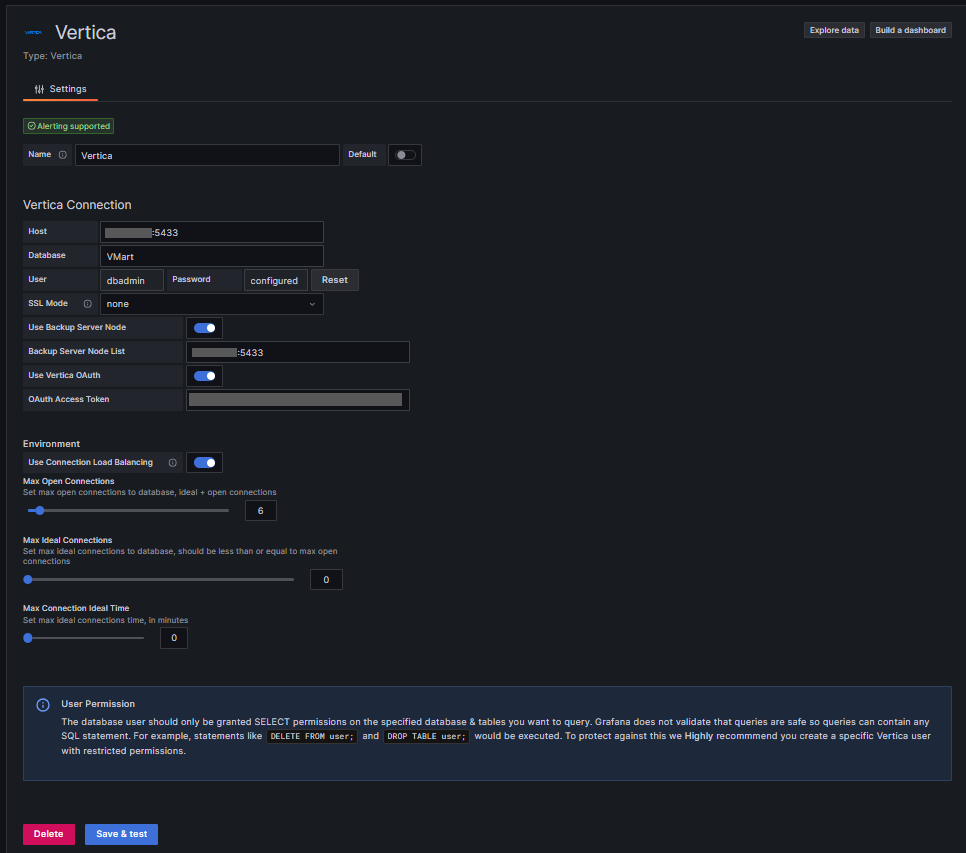
| After you add the Vertica data source, you need to configure it by entering the following fields and connection details: | Name | Description |
|---|---|---|
Name |
The data source name. | |
Default |
The data source is pre-selected for new panels. | |
Host |
The IP address/hostname and the port of your Vertica instance separated by colon (host:port). Do not include the database name as the connection string for connecting to Vertica may cause errors. | |
Database |
Name of your Vertica database. | |
User |
Database username. | |
Password |
Database user password. | |
SSL Mode |
Determines whether or with what priority a secure SSL TCP/IP connection will be negotiated with the server. When SSL Mode is disabled, SSL Method and Auth Details are not visible. | |
Use Backup Server Node |
To enable backup hosts on server side. | |
Backup Server Node List |
Comma delimited list of backup host:port for the client to try to connect if the primary host is unreachable. | |
Use Vertica OAuth |
To enable OAuth connection to Vertica database. | |
OAuth Access Token |
Use OAuth Access Token for authentication to Vertica database. | |
Use Connection Load Balancing |
To enable connection load balancing on the client-side. | |
Max Open Connections |
Maximum number of connections a user can open concurrently on individual nodes or across the database cluster. | |
Max Ideal Connections |
Maximum number of idle connections. This number should be less than or equal to Max Open Connections. | |
Max Connection Ideal Time |
Idle time after which the session times out. |
Note:
- The current OAuth setup only uses access token for authentication as per vertica-sql-go driver. Consider altering your token expiration time to extend token validity.
- To enable load balancing, the server side needs to be configured. For more information, see Connection Load Balancing in the Vertica documentation. For more information on managing client connections, see Managing Client Connections.

User Permission
When you add the data source, the database user you specify must only be granted SELECT permissions on the specified database and tables you want to query. Grafana does not validate that the query is safe. The query could include any SQL statement. For example, statements like DELETE FROM user; and DROP TABLE user; will be executed. We highly recommend you create a specific Vertica user with restricted permissions.
Note: The default query supplied with the data source requires dbadmin, pseudosuperuser, or sysmonitor role as it’s a system table.
For example,
SYSMONITOR TO grafana_user;
alter user grafana_user default role sysmonitor;
Importing and Viewing the Vertica Performance Dashboard
To import the dashboard,
- On the left panel, click the Dashboards icon, and then click Import.
- In the Import via grafana.com field, enter the dashboard ID: 16615 and click Load.

- In the Importing dashboard window, select the datasource you created and click Import.

You can now start exploring the dashboard to monitor Vertica.
Querying the Data Source
Query Builder
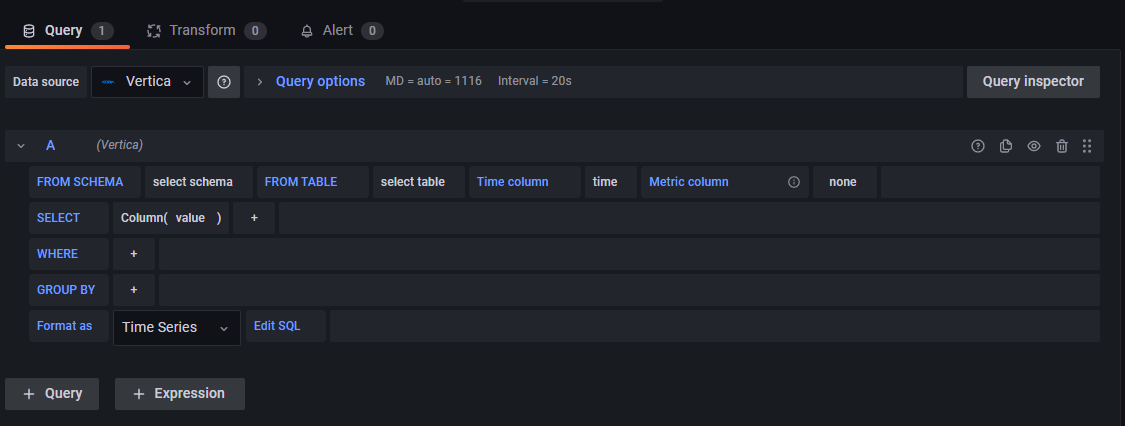
To open the query builder, click Panel Title, and then click Edit. You can switch to raw query mode to run SQL queries. To do this, click Edit SQL. For any change in the query builder, the raw query is generated and executed. The result is displayed in the dashboard.

FROM SCHEMA, FROM TABLE, Time column, and Metric column
FROM SCHEMA - Lists schemas that are available in the database for the configured user.
FROM TABLE - Lists tables that are available in the schema you selected. To manually enter a table or view that is not available in the list, type the fully qualified name in the format schema.table, for example, public.metrics.
Time column - Lists columns with data types such as time, date timestamp, etc. This field is mandatory.
Metric column - Lists columns with a text data type such as char, varchar, and long varchar. If you want to use a column with a different data type, enter the column name with a cast: ip::text. This field is optional. If a value is selected, the Metric column field will be used as the series name.
Aggregate Functions, Windows Functions, and Column (SELECT)
In the SELECT row, you can specify the columns and functions you want to use. By default, Column has "value" instead of the column name and the alias has the same name as column name which you can change.
You can use Aggregate or Window Functions on the column you selected and provide aliases to these columns. If you use aggregate function, you need to group by your result set. If an aggregate or window function is already selected and you select another function for the same column, then the previous function is replaced with new one. To add more columns, click the plus button and select Column. Multiple value columns will be plotted as separate series in the graph panel.
Filter data (WHERE)
To add a filter, click the plus button to the right of the WHERE condition. To remove the filter, click the filter and then click Remove. You cannot use the same query again after it is selected in the WHERE field. You can use other macros in the raw query mode (Edit SQL).
GROUP BY
To group by time or other columns, click the plus button to the right of the GROUP BY condition. This displays columns selected in the SELECT clause and the time column. To remove a column, click the column, and then click Remove.
Gap filling
Grafana fills in missing values when you group by time. The time function accepts two arguments. The first argument is the time window that you want to group by, and the second argument is the value you want Grafana to fill missing items with.
Raw Query Mode
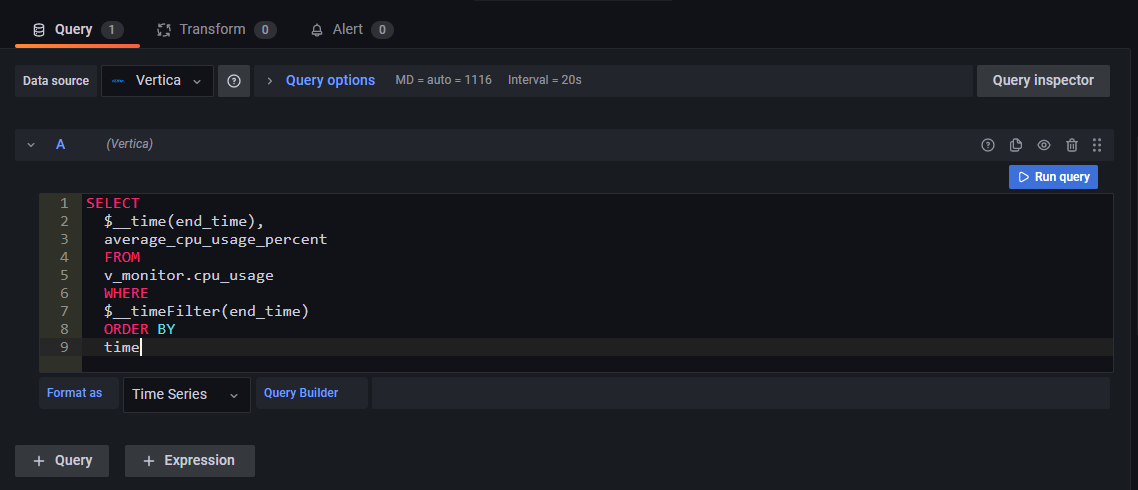
To switch to the raw query mode, click Edit SQL. You can also click Query Inspector to view the raw query.
You can now use the new Auto-completion feature in Raw Query Mode to predict keywords in your queries as you type.
To run your query, click Run Query.
Note: If you use the raw query mode, ensure your query at minimum has ORDER BY time and a filter on the returned time range.

Disable Query
To disable a query, click the eye icon in the toolbar of the query builder. The query is not executed, and its result is removed from the dashboard.
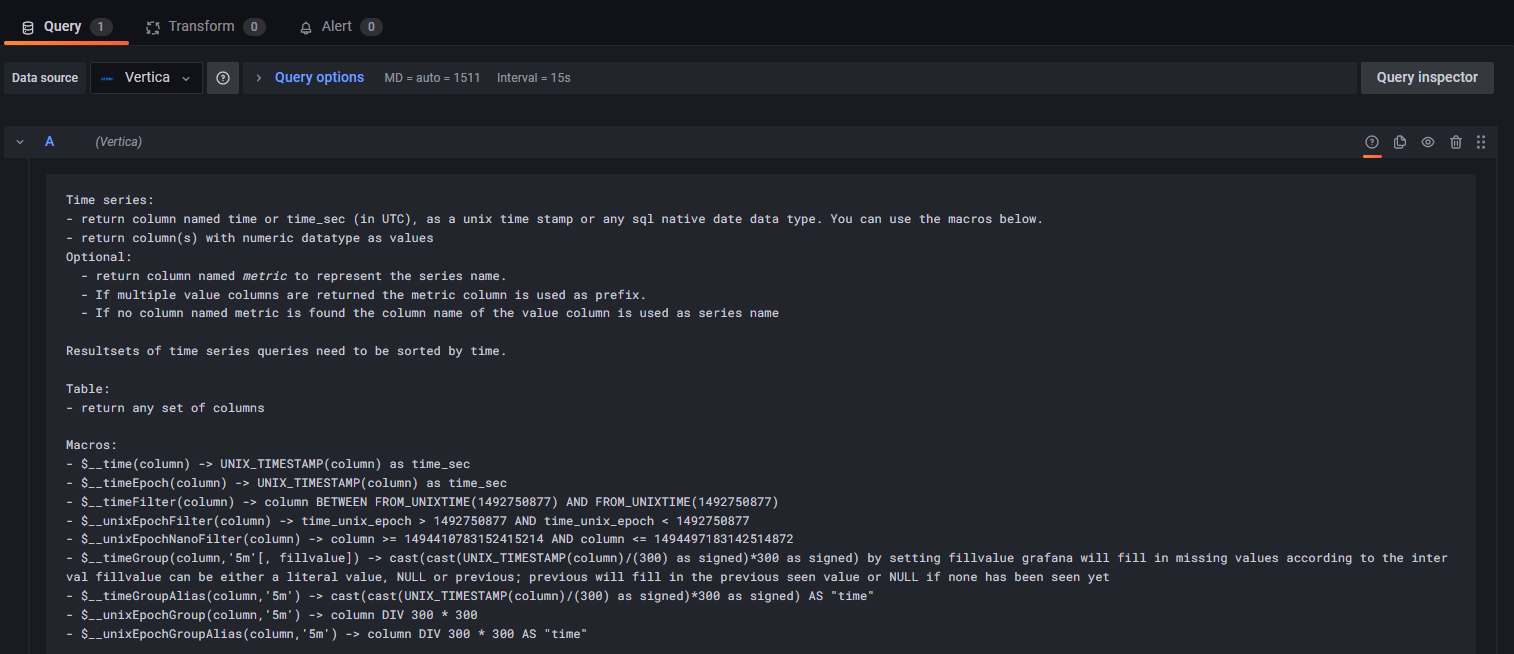
Data Source Help
To view the data source help, click ? icon in the toolbar of every query row.

Supported Macros
| Macros can be used within a query to simplify syntax and allow for dynamic parts. | Macro Example | Description |
|---|---|---|
| $__time(column) | Adds an alias 'time' to the column. For example, dateColumn as time. | |
| $__timeFilter(column) | Adds time range filter on the specified column. For example, column BETWEEN '2017-04-21T05:01:17Z' AND '2017-04-21T05:01:17Z'. | |
| $__expandMultiString(variable) | Expands single/multi-select variable so it can be used inside the 'IN' predicate. | |
| $__timeFrom() | Replaces the expression by the start timestamp of the current active time stamp. | |
| $__timeTo() | Replaces the expression by the end timestamp of the current active time stamp. | |
| $__unixEpochFilter(column) | Adds time range filter on the specified column with time represented as Unix timestamp. For example, column BETWEEN 1623090232 AND 1623150232. | |
| $__timeGroup(column, intervalVariable, [FillMode]) | Groups the data based on the value of interval variable. Optional parameter FillMode value decides how to fill the missing values in the data. | |
| $__timeGroup(column, intervalVariable, 0) | Same as above but missing values in the query result are replaced by 0. | |
| $__timeGroup(column, intervalVariable, NULL) | Same as above but missing values in the query result are replaced by NULL. | |
| $__timeGroup(column, intervalVariable, previous) | Same as above but missing values in the query result are replaced by previous row value. |
Logging
For troubleshooting, enabled logs are available in the grafana.log file. By default, the log level for grafana.log file is info. In case of any error or bug, change the log level to debug to view the debug logs.
Known Limitations
TimeGroup macro only fills missing values in the data fetched from the Vertica database. It does not create more samples based on the selected time range and interval value.
To know more about data type limitations when using Grafana with Vertica, see Vertica Integration with Grafana: Connection Guide.
Setting Up your Development Environment
If you plan to modify the source code and build your own version of the plugin, follow the steps in this section to set up the development environment.
Before you begin, if you modify the source code and rebuild the plugin, it is no longer signed. The signature is based on a hash of the distribution, so you will have to run it as unsigned.
For the plugin to load, add the following configuration parameter to the /etc/grafana/grafana.ini file in the [plugins] section:
allow_loading_unsigned_plugins = vertica-grafana-datasource

Prerequisites
Note: This plugin is tested in Linux(Ubuntu) with the following versions:
- Grafana - v10.1.2
- NodeJS - v18.18.0
- Yarn - v1.22.19
- Npm - v9.8.1
- Go - v1.21.9
Installing Vertica Grafana Data Source Plugin
Note: If you have the older version of the Vertica Grafana plugin, remove it using grafana-cli:
grafana-cli plugins remove vertica-grafana-datasource- Clone the new Vertica Grafana data source repository into the plugins directory.
- Go to the Vertica plugin folder.
-
To build the plugin
-
Install dependencies:
yarn install -
Build plugin in production mode:
yarn build -
Build backend plugin binaries for Linux, Windows, and Darwin:
mage -v
-
- Restart the Grafana server.