Weex Devtools 中文版
Weex devtools is a custom devtools for weex that implements Chrome Debugging Protocol inspired by Stetho, it is designed to help you quickly inspect your app and debug your JS bundle source in a chrome web page. To make it work, at first you must install [weex-devtool] (https://github.com/weexteam/weex-devtool) as debug server. And then the prompt chrome page will introduce you two main devtools functionalities Inspector and Debugger:
-
Inspector Inspector can be used to show your
Element\Network\Console log\Screencast\BoxModel\Native Viewand so on. -
Debugger Debugger can be used to debug your bundle js source, you can set
Breakpoint\ watchCallStack.
Install and launch devtools server
Open your terminal then type npm install -g weex-toolkit and run.Launch it just type and run the command weex debug, then a Chrome web page will be opened.
Use on an android device or emulator
Taste of first debug with playground
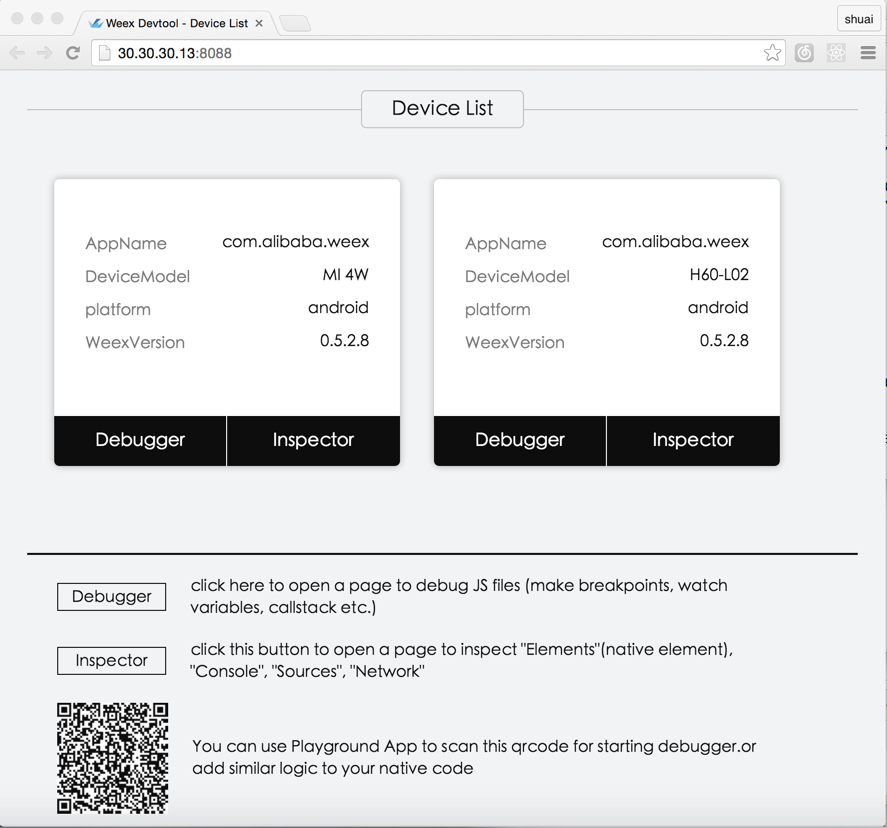
If you are a green hand to the debug of weex, we recommend you to try your first debug with playground, what you need to do is just launch the playground and scan the QR code shown in the debug page which wound opened if the devtools server have been launched. after you scan the QR code, the web page will list your connected devices.

How Debugger Works
Devtools expands Chrome Debugging Protocol and the mechanism of communication between client and debug sever is based on JSON-RPC.
Devtools Client
Devtools Client is integrated in App as aar, it connects to debug server through webscoket protocol with out permission check. I recommend you just packaged it in your debug version consider of the security mechanism.
Devtools Debug Server
Devtools Debug Server is the center node of the communication, it connects to both app and chrome, acts as the turn server of debugging protocol messages and the manager of the js runtime.
Chrome FrontEnd
Chrome's V8 engine acts as the javascript runtime, when debug mode is enabled, all the js code run on it. On the other side we also reuse most of the Chrome's debugging user interface, such as set breakpoint, see call stack and so on.

Enable devtools in your own app
Of course you can reuse the code of playground to build your own app, that is the simplest way to let your app's js code debuggable. On the other hand QR code is not necessary, if your review the source code you can draw a conclusion that QR CODE is just a way to set devtools server address. following those steps you can do the same thing.
Gradle dependency on inspector.
There are two choices to set the dependency, the Choice A is recommanded if you have no change to weex_sdk or inspector, while if you use your own custom weex_sdk or inspector Choice B is suitable.
-
A - aar dependency from jcenter.
dependencies {
      compile 'com.taobao.android:weex_inspector:0.8.0.0'
}
I strongly recommend you use the latest version since both weex sdk and devtools are developed iteratively and rapidly. See the release version list here. All the release version will publish to the jcenter repo.
-
B - source code dependency.
you need to copy the dir of inspector to the same dir of your app and add
include ":inspector"in your project'ssettings.gradlefile just like playground have done, then add dependency in your app'sbuild.gralde.dependencies { compile project(':inspector') }
Initialize in your XXXApplication file.
    public class MyApplication extends Application {
      public void onCreate() {
      super.onCreate();
      initDebugEnvironment(true, "xxx.xxx.xxx.xxx"/*"DEBUG_SERVER_HOST"*/);
      }
      private void initDebugEnvironment(boolean enable, String host) {
        WXEnvironment.sRemoteDebugMode = enable;
        WXEnvironment.sRemoteDebugProxyUrl = "ws://" + host + ":8088/debugProxy/native";
      }
}
Ship It!
- You must launch your bundle server firstly. In your weex dir, run command "./start";
- Launch your remote debug server. Run command
weex debug, chrome will open a web page show a simply guidance and QR code; - Launch your app and make sure debug mode was enabled. You will see a device list in the chrome web page opened by last step, each device item have two button,
DebuggerandInspector;There are two way to enable debug mode:- scaning the QR code and handle the content just like the playground have done.
- init it in the XXXApplication by calling
initDebugEnvironment(true, "xxx.xxx.xxx.xxx"), if you callinitDebugEnvironment(true, "xxx.xxx.xxx.xxx")after weex sdk inited, you need to callWXSDKEngine.reload()to refresh the runtime.
- Once you click the button
Inspectorchrome will open a page show the inspector view, on the other side, click the buttonDebuggerchrome will open a new page to show the debug view;
OPTIONS
[OPTION] set your remote bundle server ip.
For example, in the playground it is in the `IndexActivity.java`, you need to change the value of `DEFAULT_IP` in IndexActivity.java from `"your_current_IP"` to a server ip like `"30.30.30.150"`: private static final String DEFAULT_IP = "30.30.30.150"; // "your_current_IP";[OPTION] enable network inspection.
OkHttpClient client = new OkHttpClient();
client.networkInterceptors().add(new OkHttpInterceptor());
Notice
The network inspection only support OKHttpClient right now!!! If you want to use the network inspection to catch your bundle request, you must change your bundle server ip to the real server ip.


