 aphyr
commented
5 years ago
aphyr
commented
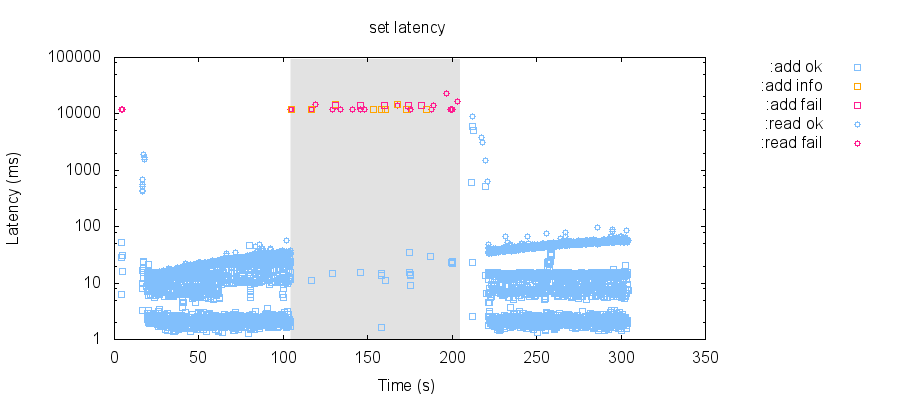
5 years ago This is a slightly different workload which performs single-row inserts and all-row reads throughout the test, instead of waiting for recovery before doing a read. When we schedule partitions in long-running patterns, it looks like it takes about 20 seconds to fully recover:

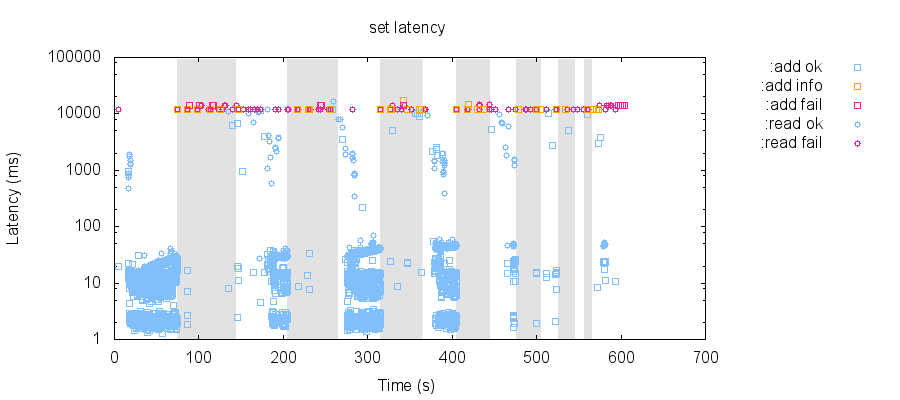
However, that same workload with 30s/30s healthy/partitioned cycles results in a cluster which never appears to recover to a healthy state. I'm wondering if more rapid (~30s) changes in network topology can knock YB into a confused state that takes longer to recover from...


 amitanandaiyer
 kmuthukk
 ttyusupov
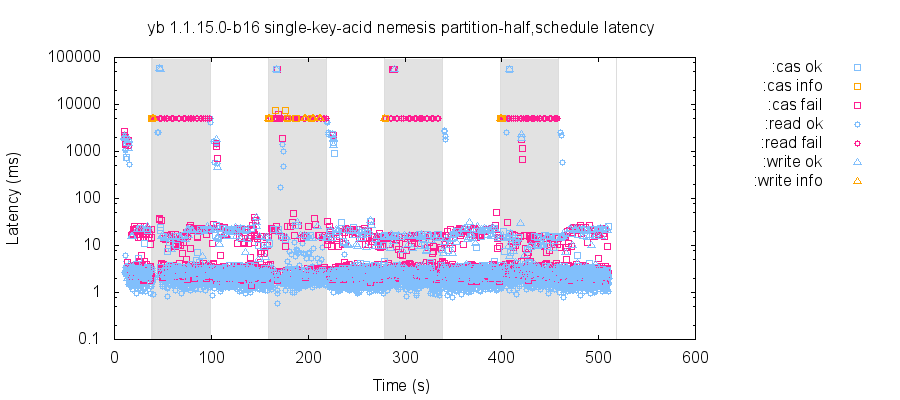


This may not be a real issue in YB; I'm still exploring behavior and collecting more evidence!
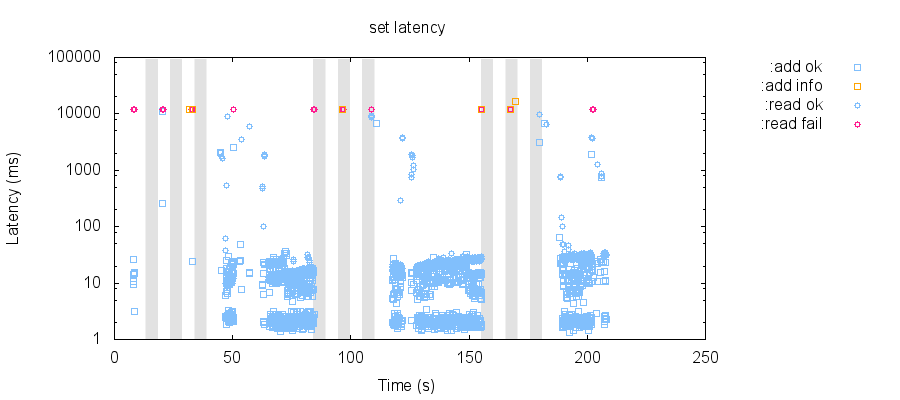
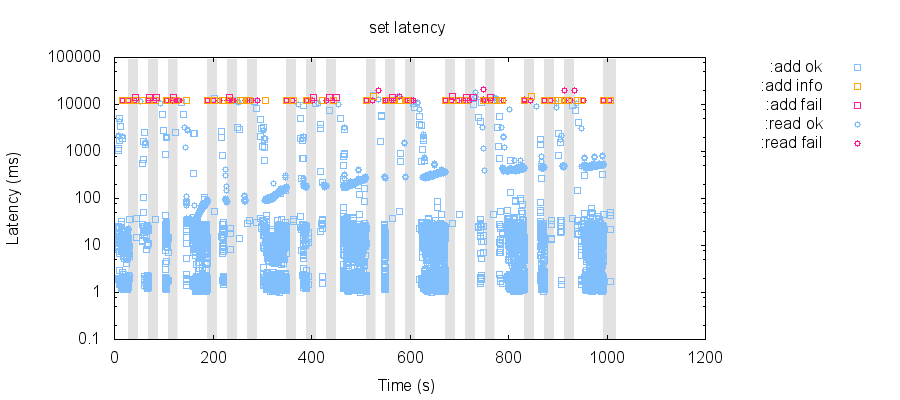
On Yugabyte CE, version 1.1.10.0, recovery from network partitions seems to take a little longer than one might expect. In particular, when performing a series of single-row CQL inserts during a mixture of randomized 3/2 split network partitions, followed by the end of all partitions, 30 seconds for the cluster to heal, and a final read of all rows, that read consistently times out.
This cluster is running on 5 nodes, with replication factor 3. n1, n2, and n3 are masters; n1, n2, n3, n4, and n5 are tservers.
For instance, in this test, the second partition (the shaded region in this plot) appears to prevent all clients from performing writes, and even with 30 seconds of recovery before the final read, that read times out:
This may be expected behavior, or might be some sort of client issue, so I'm going to keep exploring. I'll update this issue as I find out more. :)