Docker Swarm - Promitheus, Grafana, Node Exporter, Loki, Promtail, Caddy
Stack for monitoring and logging:
Prerequisites:
- Docker CE 19.03.6+
- Swarm cluster with one manager and a worker node
Install
Clone this repository and run the monitoring stack:
$ git clone https://github.com/zet694/promitheus_monitoring
$ cd promitheus_monitoring

ADMIN_USER=admin \
ADMIN_PASSWORD=admin \
docker stack deploy -c docker-compose.yml mon
Services:
- prometheus (metrics database)
http://<swarm-ip>:9090 - grafana (visualize metrics)
http://<swarm-ip>:3000 - node-exporter (host metrics collector)
- dockerd-exporter (Docker daemon metrics collector, requires Docker experimental metrics-addr to be enabled)
- caddy (reverse proxy and basic auth provider for prometheus)
Setup Grafana
Navigate to http://<swarm-ip>:3000 and login with user admin password admin.
You can change the credentials in the compose file or
by supplying the ADMIN_USER and ADMIN_PASSWORD environment variables at stack deploy.
Swarmprom Grafana is preconfigured with two dashboards and Prometheus as the default data source:
- Name: Prometheus
- Type: Prometheus
- Url: http://prometheus:9090
- Access: proxy
After you login, click on the home drop down, in the left upper corner and you'll see the dashboards there.
Docker Swarm Nodes Dashboard

URL: http://<swarm-ip>:3000/dashboard/db/docker-swarm-nodes
This dashboard shows key metrics for monitoring the resource usage of your Swarm nodes and can be filtered by node ID:
- Cluster up-time, number of nodes, number of CPUs, CPU idle gauge
- System load average graph, CPU usage graph by node
- Total memory, available memory gouge, total disk space and available storage gouge
- Memory usage graph by node (used and cached)
- I/O usage graph (read and write Bps)
- IOPS usage (read and write operation per second) and CPU IOWait
- Running containers graph by Swarm service and node
- Network usage graph (inbound Bps, outbound Bps)
- Nodes list (instance, node ID, node name)
Docker Swarm Services Dashboard
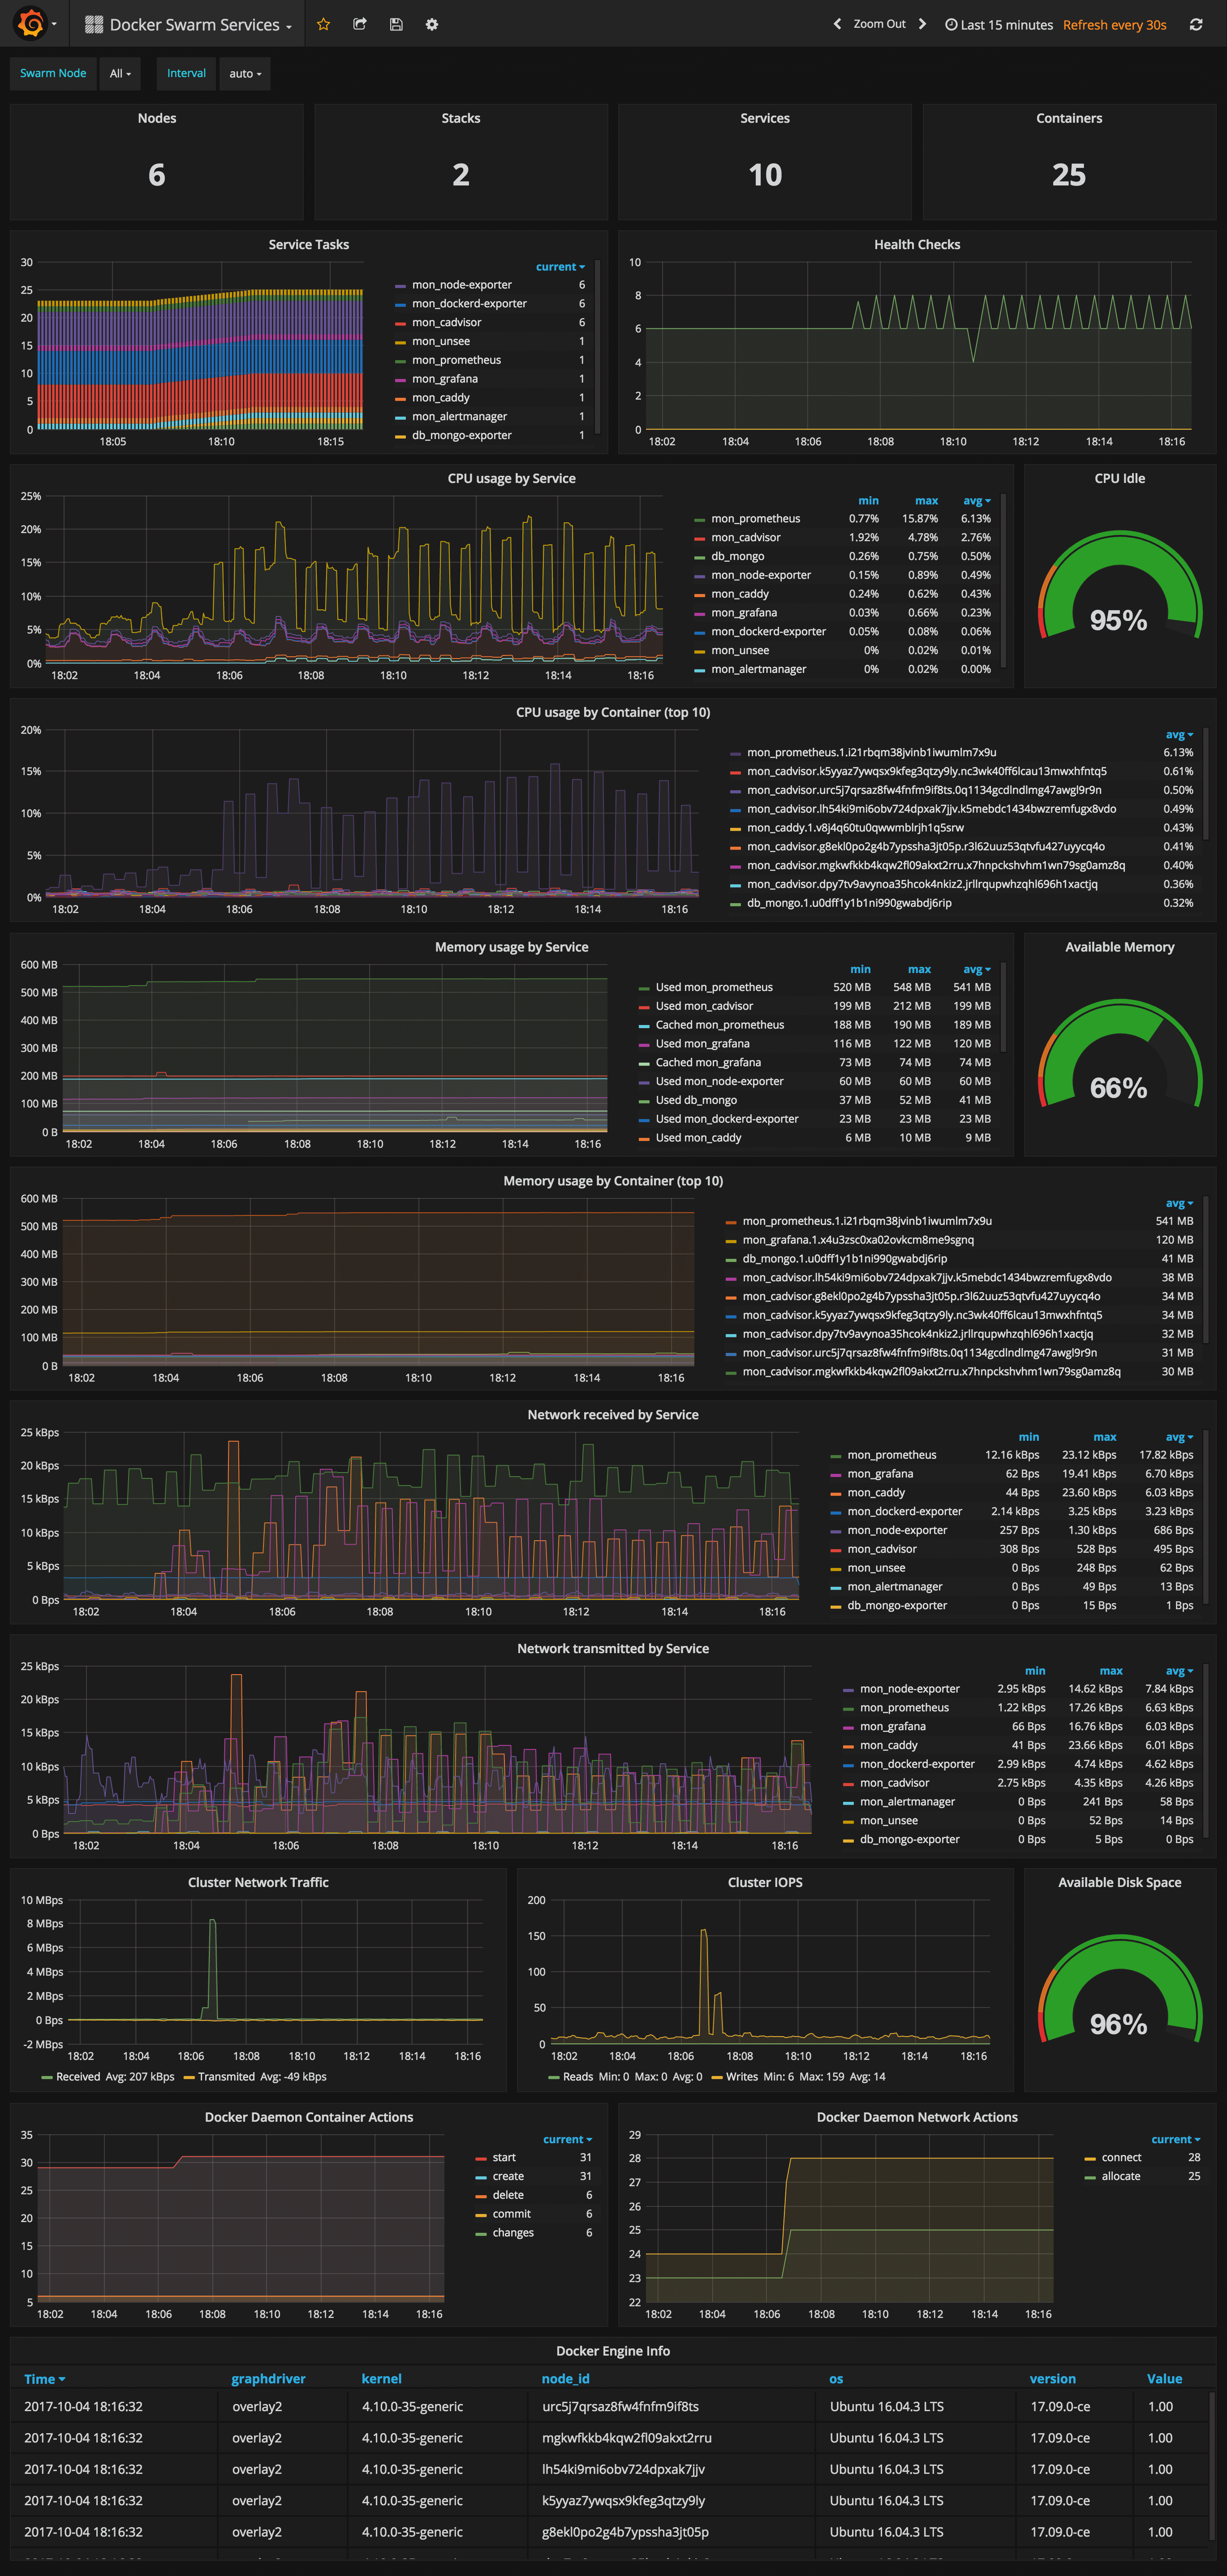
URL: http://<swarm-ip>:3000/dashboard/db/docker-swarm-services
This dashboard shows key metrics for monitoring the resource usage of your Swarm stacks and services, can be filtered by node ID:
- Number of nodes, stacks, services and running container
- Swarm tasks graph by service name
- Health check graph (total health checks and failed checks)
- CPU usage graph by service and by container (top 10)
- Memory usage graph by service and by container (top 10)
- Network usage graph by service (received and transmitted)
- Cluster network traffic and IOPS graphs
- Docker engine container and network actions by node
- Docker engine list (version, node id, OS, kernel, graph driver)
Prometheus service discovery
In order to collect metrics from Swarm nodes you need to deploy the exporters on each server. Using global services you don't have to manually deploy the exporters. When you scale up your cluster, Swarm will launch a cAdvisor, node-exporter and dockerd-exporter instance on the newly created nodes. All you need is an automated way for Prometheus to reach these instances.
Running Prometheus on the same overlay network as the exporter services allows you to use the DNS service discovery. Using the exporters service name, you can configure DNS discovery:
scrape_configs:
  - job_name: 'node-exporter'
    dns_sd_configs:
    - names:
      - 'tasks.node-exporter'
      type: 'A'
      port: 9100
When Prometheus runs the DNS lookup, Docker Swarm will return a list of IPs for each task. Using these IPs, Prometheus will bypass the Swarm load-balancer and will be able to scrape each exporter instance.
The problem with this approach is that you will not be able to tell which exporter runs on which node. Your Swarm nodes' real IPs are different from the exporters IPs since exporters IPs are dynamically assigned by Docker and are part of the overlay network. Swarm doesn't provide any records for the tasks DNS, besides the overlay IP. If Swarm provides SRV records with the nodes hostname or IP, you can re-label the source and overwrite the overlay IP with the real IP.
In order to tell which host a node-exporter instance is running, I had to create a prom file inside the node-exporter containing the hostname and the Docker Swarm node ID.
When a node-exporter container starts node-meta.prom is generated with the following content:
"node_meta{node_id=\"$NODE_ID\", node_name=\"$NODE_NAME\"} 1"