-
It looks like the 120 GB data cubes used by the timeseries service for the prism data set variables are entirely zeros. Running gdallocationinfo at various positions returns zeros for all bands, and …
-
-
Now that the parser is already having to inspect each stage for correctness, it shouldn't be _too_ much surgery to add a `graph` subcommand that either prints a stage graph in the CLI or outputs `dot`…
-
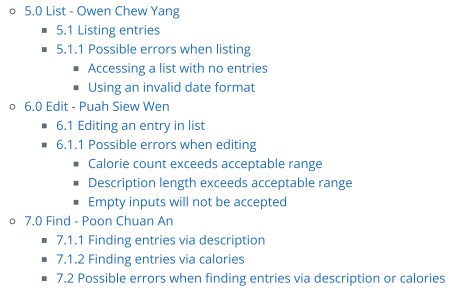
The subsections like 10.1 and 10.1.1 were all aligned it was non-intuitive that 10.…
-
option for changing the graph style
- scatterplot
- bubble plot
- 2d density plot
- bubble map
- choropleth map
- tree plot
- boxplot
- violin
- venn diagram
- stacked barplot
- a…
-
Stuart Lynne did some excellent work with graphing the chip times collected by CrossMgrImpinj when using quadratic regression. It would be useful if CrossMgrImpinj allowed the operator to click on the…
-
The history graph is only good for a week. Given that a year's worth of daily data would consume 0.0004% of a 32G phone's storage, and Moore's Law, there seems to be little reason to limit the histor…
-
-
My default graphing library is `Plots.jl`, but PBA clashes with it:
```jl
julia> a = uniform(0, 1)
Pbox: ~ uniform ( range=[0.0, 1.0], mean=0.5, var=0.083333)
julia> using Plots
julia> p…
-
Emma noted: I noticed something weird when testing new meshes. Using the same config file, when I run RM demos vs Unity demos (Palace and Wendy), the meshes are flipped in the y-direction. I believe t…