We have retired the DoiT International BigQuery DataSource plugin for Grafana, ceased all development, and put maintenance on indefinite hold. We recommend you migrate to the official Google BigQuery data source maintained by Grafana.
BigQuery DataSource for Grafana
A production-ready BigQuery DataSource plugin that provides support for BigQuery as a backend database.
Quick Start
There are multiple ways to install bigquery-grafana. See INSTALL for more information.
Features:
- Query setup
- Raw SQL editor
- Query builder
- Macros support
- Additional functions
- Table view
- Annotations
- BQ queries in variables
- Sharded tables (
tablename_YYYYMMDD) - Partitioned Tables
- Granular slot allocation (Running queries in a project with flat-rate pricing)
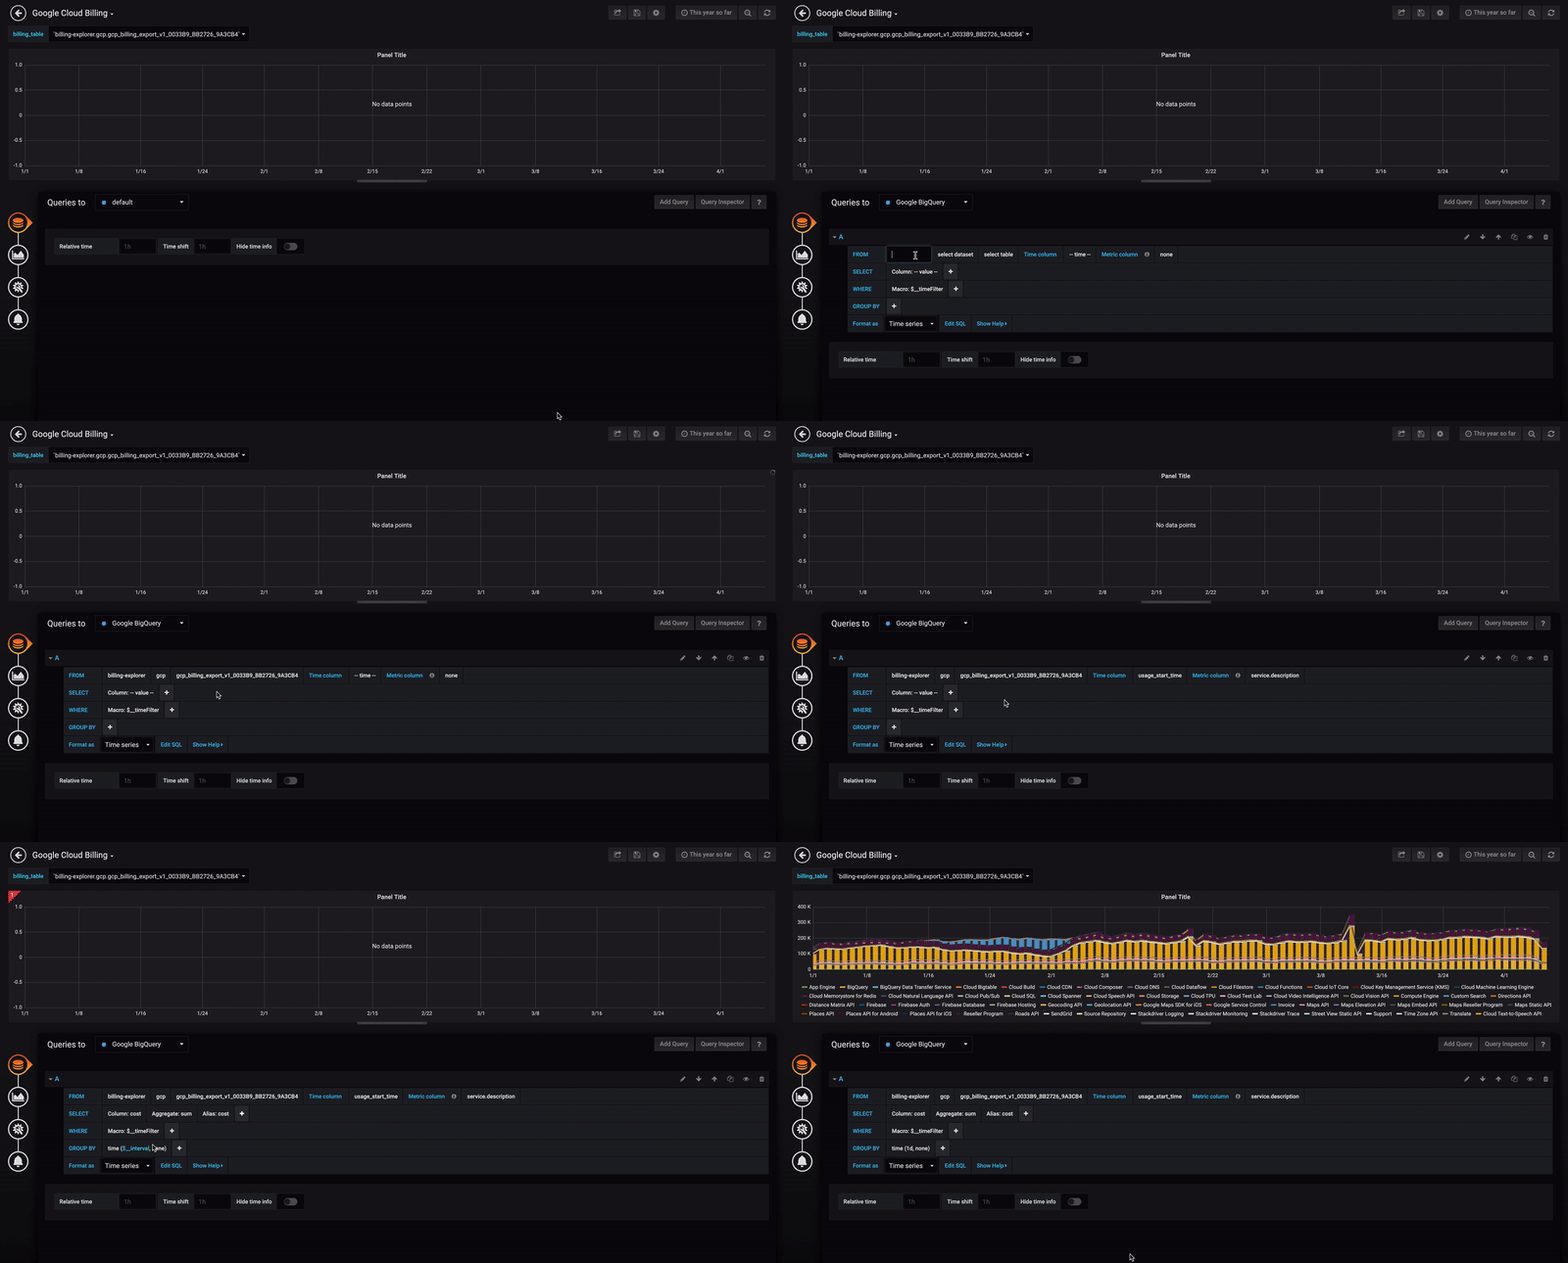
Plugin Demo:

Adding the DataSource to Grafana
- Open the side menu by clicking the Grafana icon in the top header.
- In the side menu under
Dashboardsyou should find a link namedData Sources. - Click the
+ Add data sourcebutton in the top header. - Select
BigQueryfrom the Type dropdown. - Upload or paste in the Service Account Key file. See below for steps on how to create a Service Account Key file.
NOTE: If you're not seeing the
Data Sourceslink in your side menu it means that your current user does not have theAdminrole for the current organization.
| Name | Description |
|---|---|
| Name | The datasource name. This is how you refer to the datasource in panels & queries. |
| Default | Default datasource means that it will be pre-selected for new panels. |
| Service Account Key | Service Account Key File for a GCP Project. Instructions below on how to create it. |
Set query priority
You can now set query priority "INTERACTIVE" or "BATCH" per datasouce

Example of Provisioning a File
You can manage DataSource via provisioning system. See the example below of a configuration file.
apiVersion: 1

datasources:
- name: <Datasource Name>
  type: doitintl-bigquery-datasource
  access: proxy
  isDefault: true
  jsonData:
       authenticationType: jwt
       clientEmail: <Service Account Email>
       defaultProject: <Default Project Name>
       tokenUri: https://oauth2.googleapis.com/token
  secureJsonData:
       privateKey: |
          -----BEGIN PRIVATE KEY-----
           <Content of the Private Key>
          -----END PRIVATE KEY-----
  version: 2
  readOnly: false
Authentication
There are two ways to authenticate the BigQuery plugin - either by uploading a Google JWT file, or by automatically retrieving credentials from Google's metadata server. The latter is only available when running Grafana on a GCE virtual machine.
Using a Google Service Account Key File
To authenticate with the BigQuery API, you need to create a Google Cloud Platform (GCP) Service Account for the Project you want to show data for. A Grafana datasource integrates with one GCP Project. If you want to visualize data from multiple GCP Projects then you can give the service account permissions in each project or create one datasource per GCP Project.
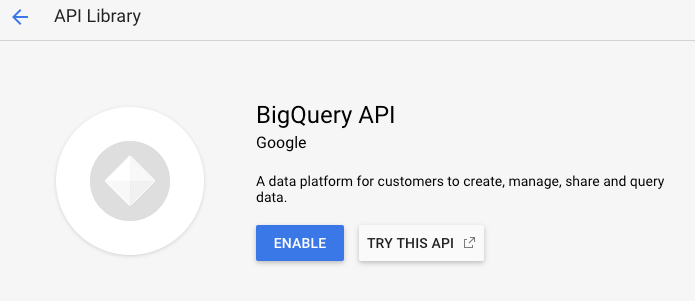
Enable APIs
Go to BigQuery API and Enable the API:

Create a GCP Service Account for a Project
-
Navigate to the APIs & Services Credentials page.
-
Click on
Create credentialsand chooseService account key.
-
On the
Create service account keypage, choose key typeJSON. Then in theService Accountdropdown, choose theNew service accountoption:
-
Some new fields will appear. Fill in a name for the service account in the
Service account namefield and then choose theBigQuery Data ViewerandBigQuery Job Userroles from theRoledropdown:
-
Click the
Createbutton. A JSON key file will be created and downloaded to your computer. Store this file in a secure place as it allows access to your BigQuery data. -
Upload it to Grafana on the datasource Configuration page. You can either upload the file or paste in the contents of the file.

-
The file contents will be encrypted and saved in the Grafana database. Don't forget to save after uploading the file!

Using GCE Default Service Account
If Grafana is running on a Google Compute Engine (GCE) virtual machine, it is possible for Grafana to automatically retrieve default credentials from the metadata server. This has the advantage of not needing to generate a private key file for the service account and also not having to upload the file to Grafana. However for this to work, there are a few preconditions that need to be met.
- First of all, you need to create a Service Account that can be used by the GCE virtual machine. See detailed instructions on how to do that here.
- Make sure the GCE virtual machine instance is being run as the service account that you just created. See instructions here.
- Allow access to the
BigQuery APIscope. See instructions here.
Read more about creating and enabling service accounts for GCE VM instances here.
Using the Query Builder
The query builder provides a simple yet a user-friendly interface to help you quickly compose a query. The builder enables you to define the basic parts of your query, The common ones are:
- The table you want to query from
- The time field and metric field
-
WHERE clause - Either use one of the pre-defined macros, to speed your writing time, or set up your own expression. Existing supported Macros are:
a. Macro $__timeFiler with last 7 days example:
WHERE `createDate` BETWEEN TIMESTAMP_MILLIS (1592147699012) AND TIMESTAMP_MILLIS (1592752499012) AND _PARTITIONTIME >= '2020-06-14 18:14:59' AND _PARTITIONTIME < '2020-06-21 18:14:59'b. Macro $__timeFrom with last 7 days example:
WHERE `createDate` > TIMESTAMP_MILLIS (1592223758609) AND _PARTITIONTIME >= '2020-06-15 15:22:38' AND _PARTITIONTIME < '2020-06-22 15:22:38'c. Macro $__timeTo with last 7 days example:
WHERE `createDate` < TIMESTAMP_MILLIS (1592828659681) AND _PARTITIONTIME >= '2020-06-15 15:24:19' AND _PARTITIONTIME < '2020-06-22 15:24:19'You can now use timeFilter macro in raw sql mode
- GROUP BY option - You can use a pre-defined macro or use one of the fields from your query a. time ($__interval,none)
- ORDER BY option
Note: If your processing location is not the Default US one set your location from the processing Location drop-down at the top right bottom of the query builder
Troubleshooting
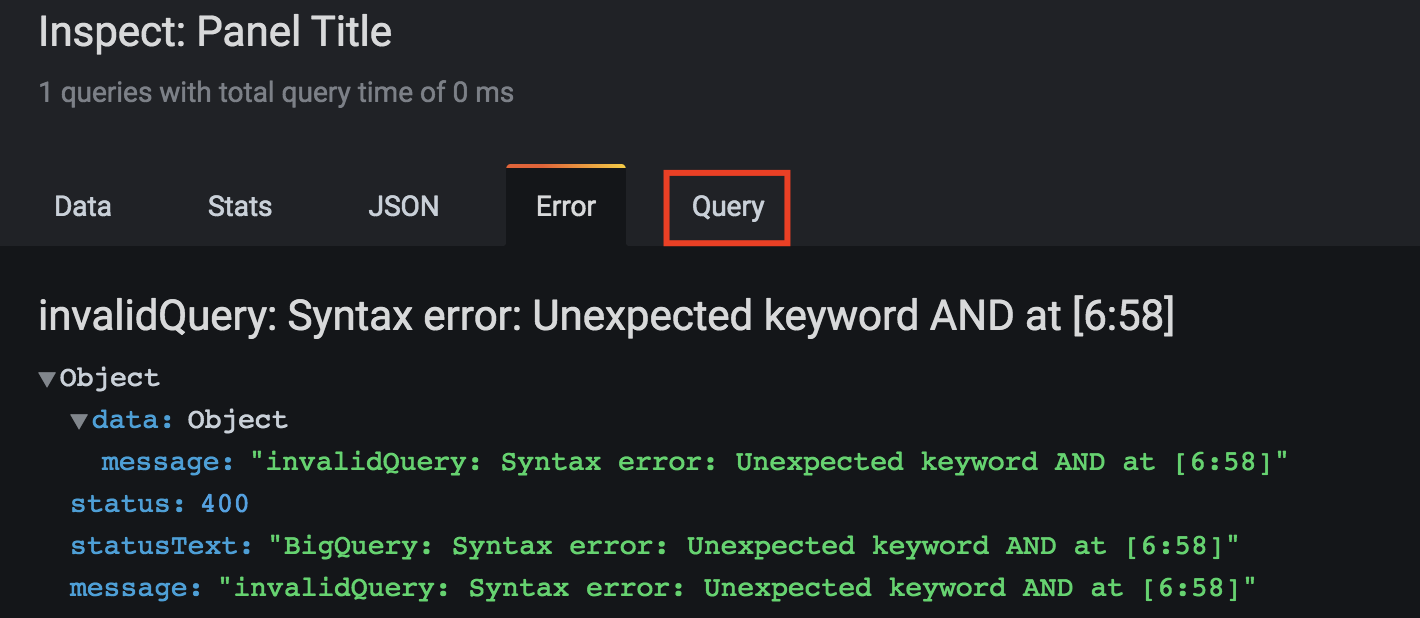
Viewing your Query
- Use The Query Inspector located at the top of the query builder

- The query Inspector enables you to see the clean query and troubleshoot SQL errors
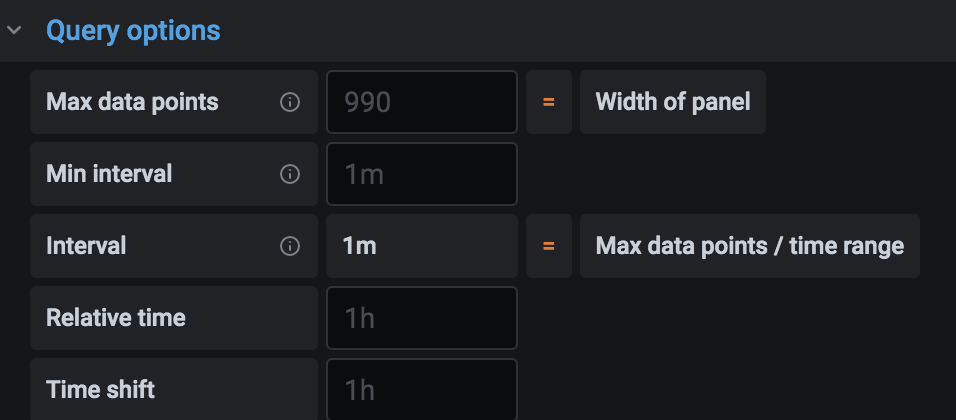
 The Query builder comes with a set of defaults which are control from the top of the Query Builder


Build
The build works with Yarn:
Development Build
yarn run build:devProduction Build
yarn run build:prodTests can be run with Jest:
yarn run testContributing
See the CONTRIBUTING file.
License
See the LICENSE file.


