Equities Pair Trading/Statistical Arbitrage and Multi-Variable Index Regression
Small project to experiment with Plotly Dash and MongoDB (NoSQL database) by designing and building a full application to provide an interactive dashboard for traders to easily backtest equities pair trading/statistical arbitrage strategies on US single stocks (Nasdaq-100, S&P 500, Russell 2000) and investigate equity index vs single stock relationships.
Video Demonstration

Screenshots
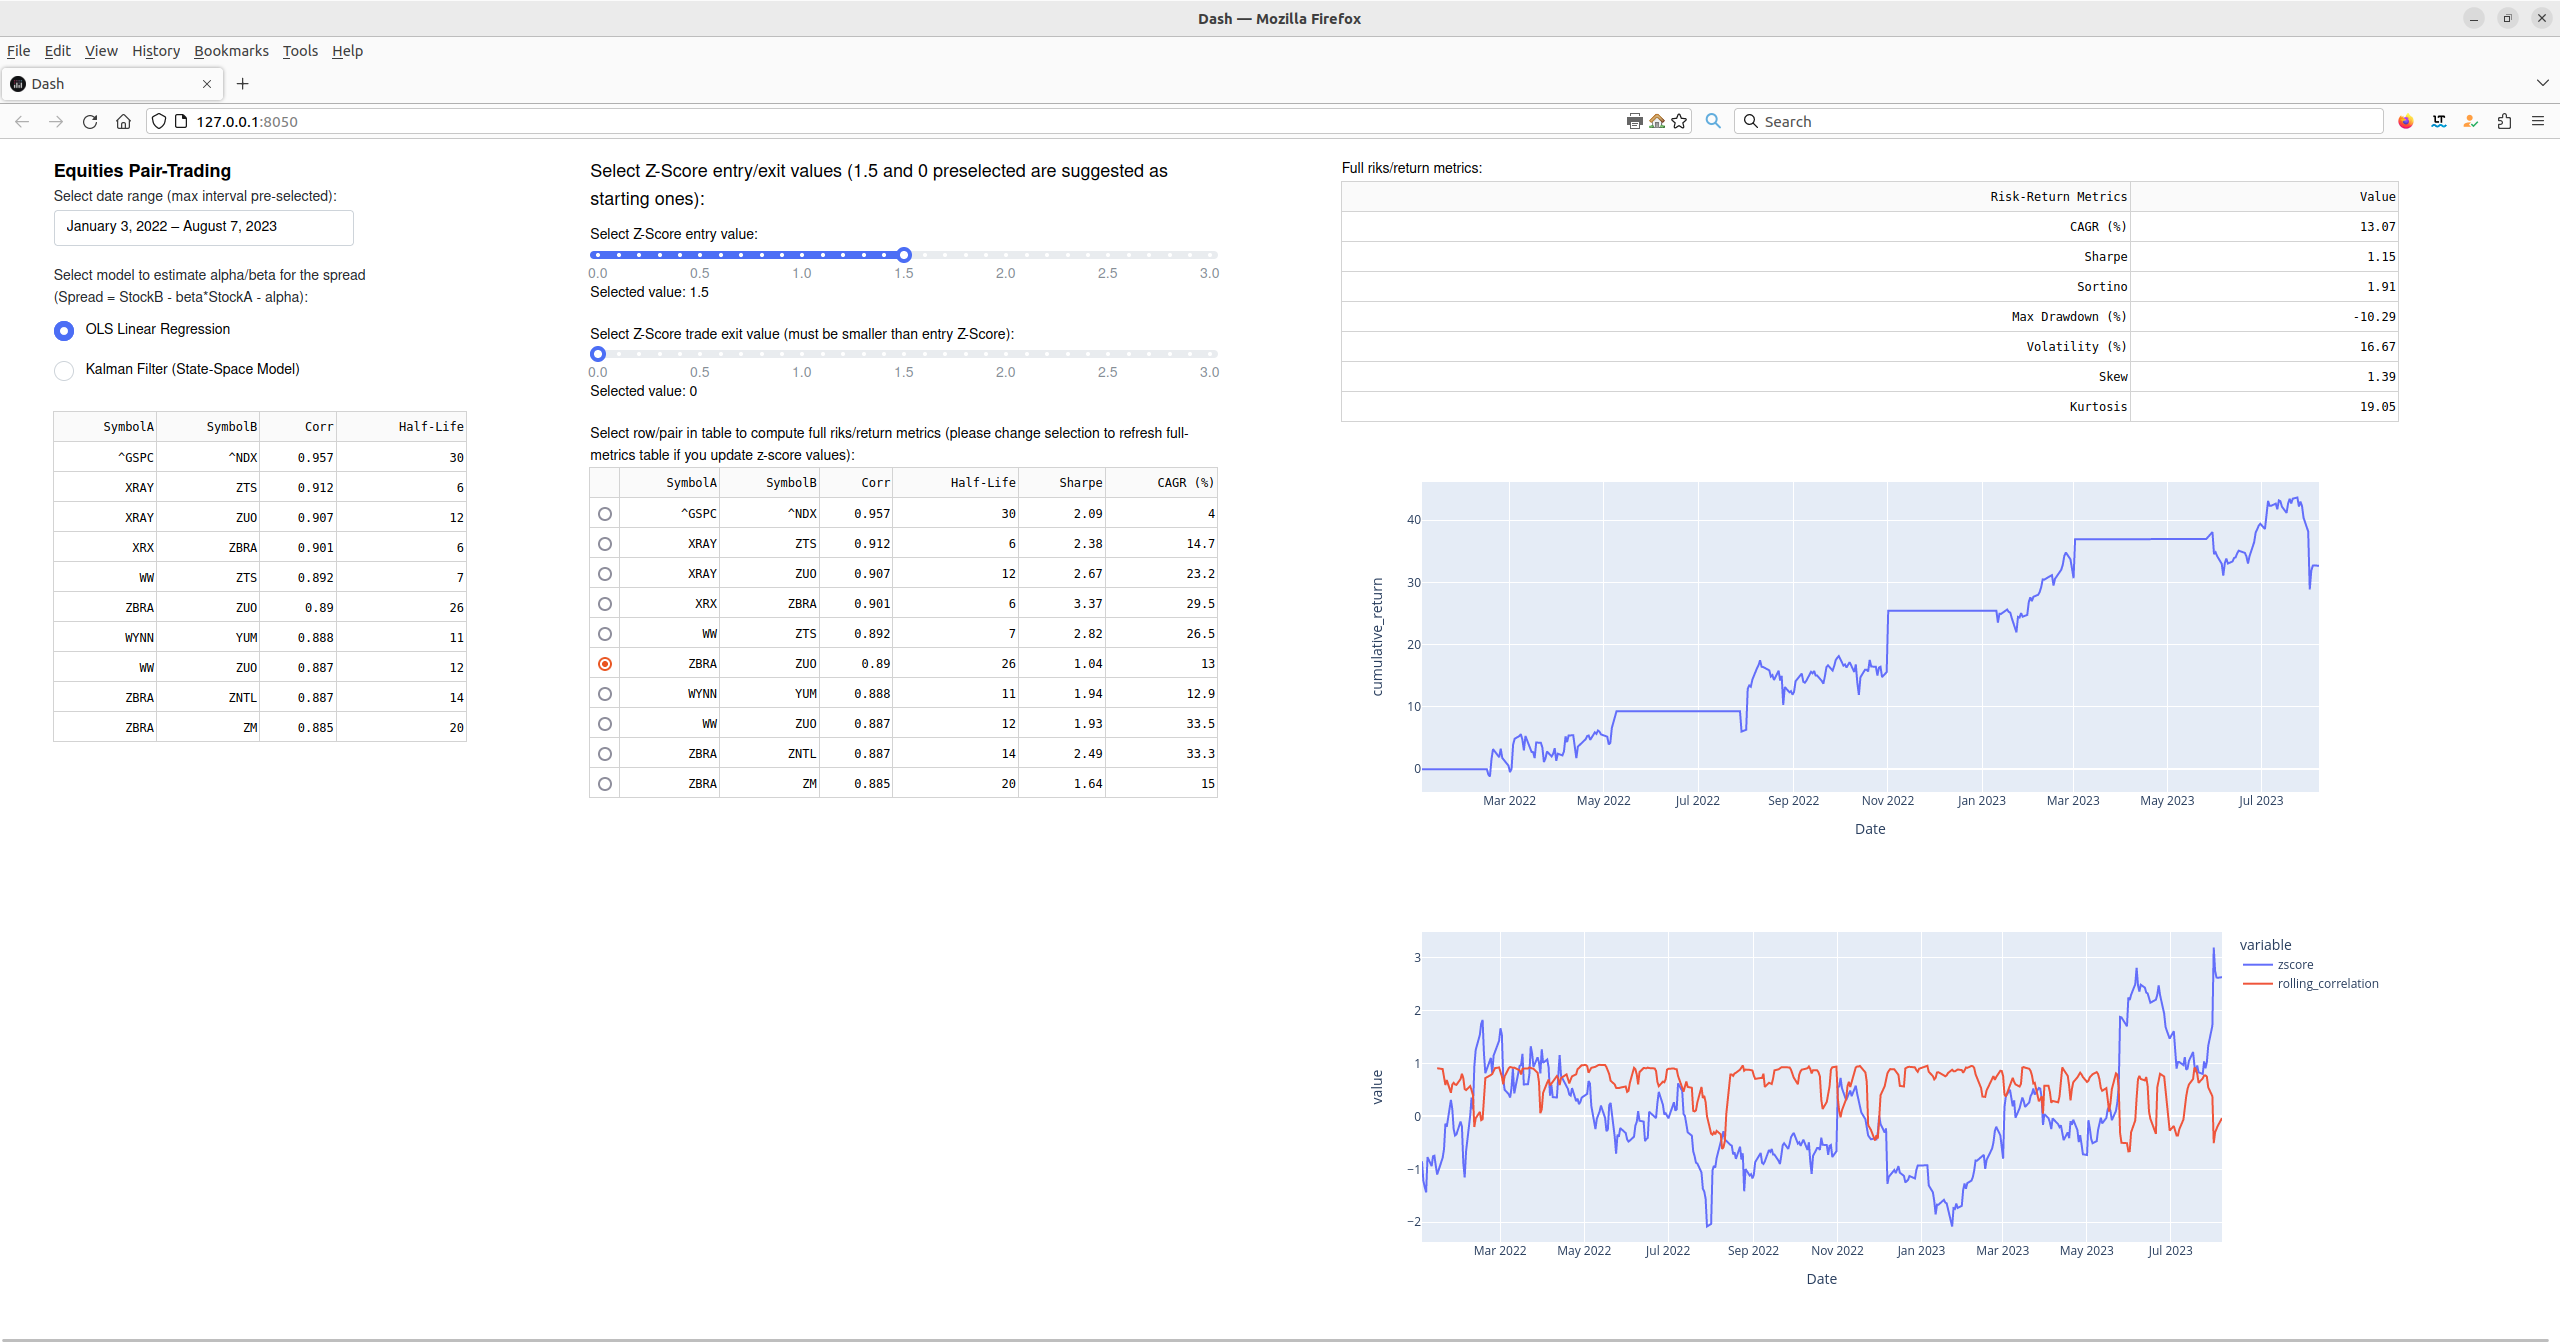
Equities Pair Trading/Statistical Arbitrage
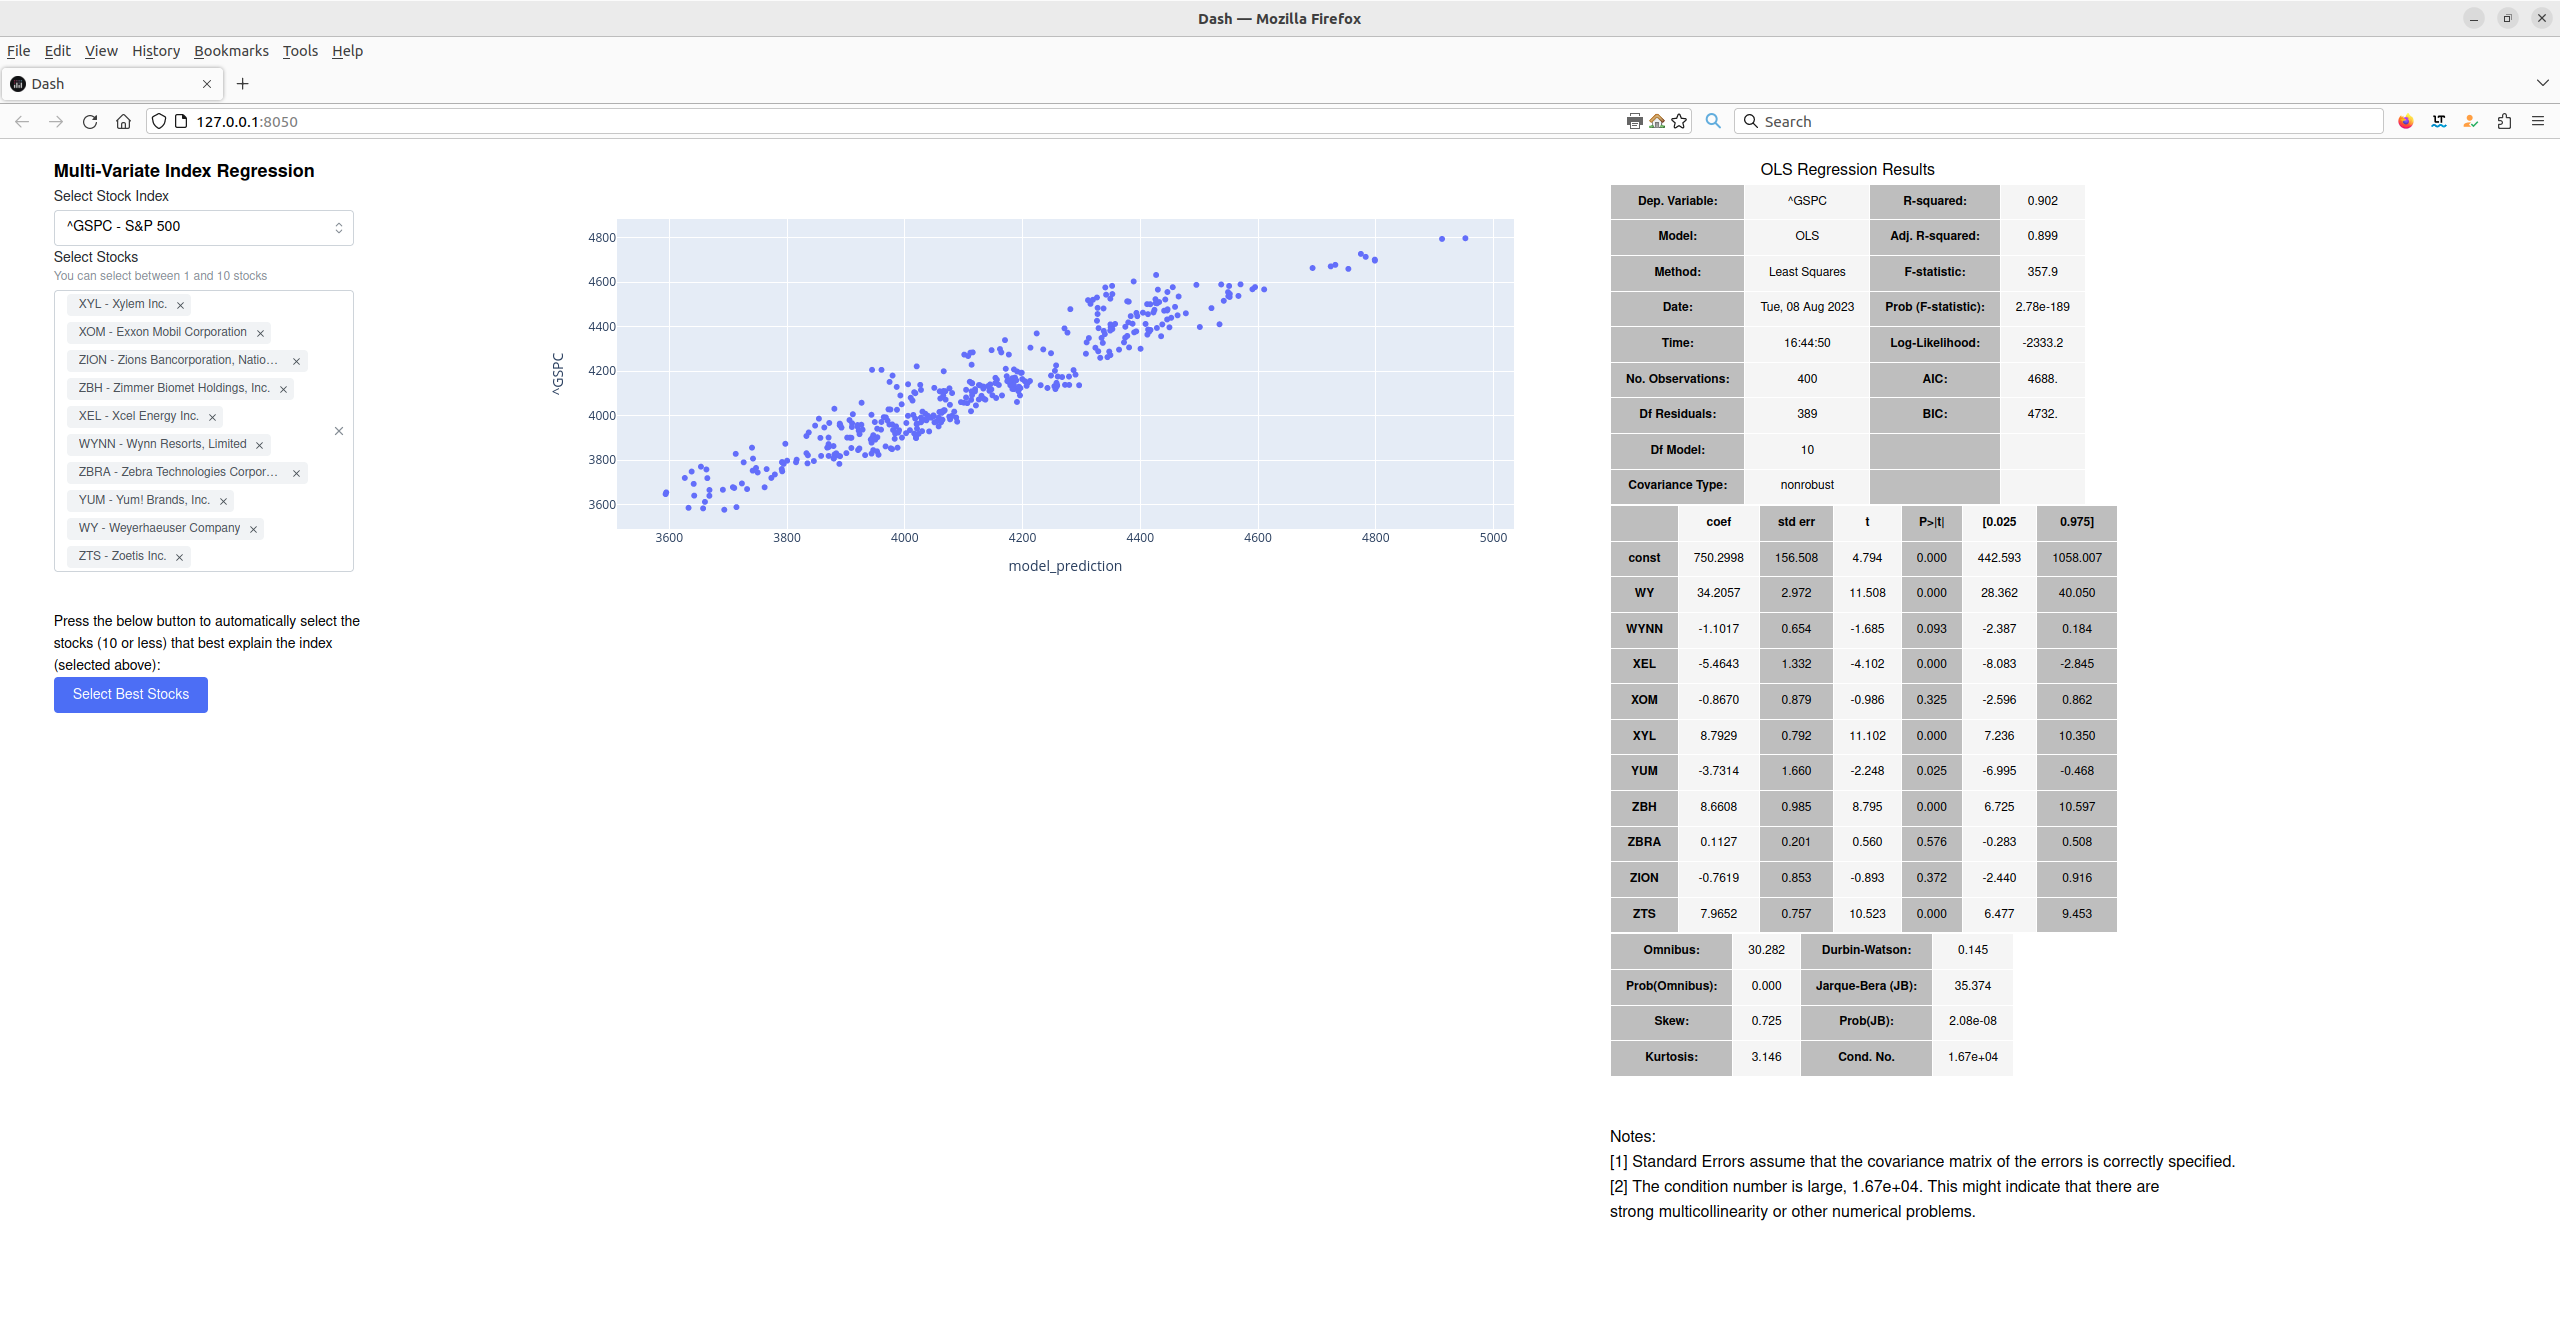
Multi-Variable Index Regression
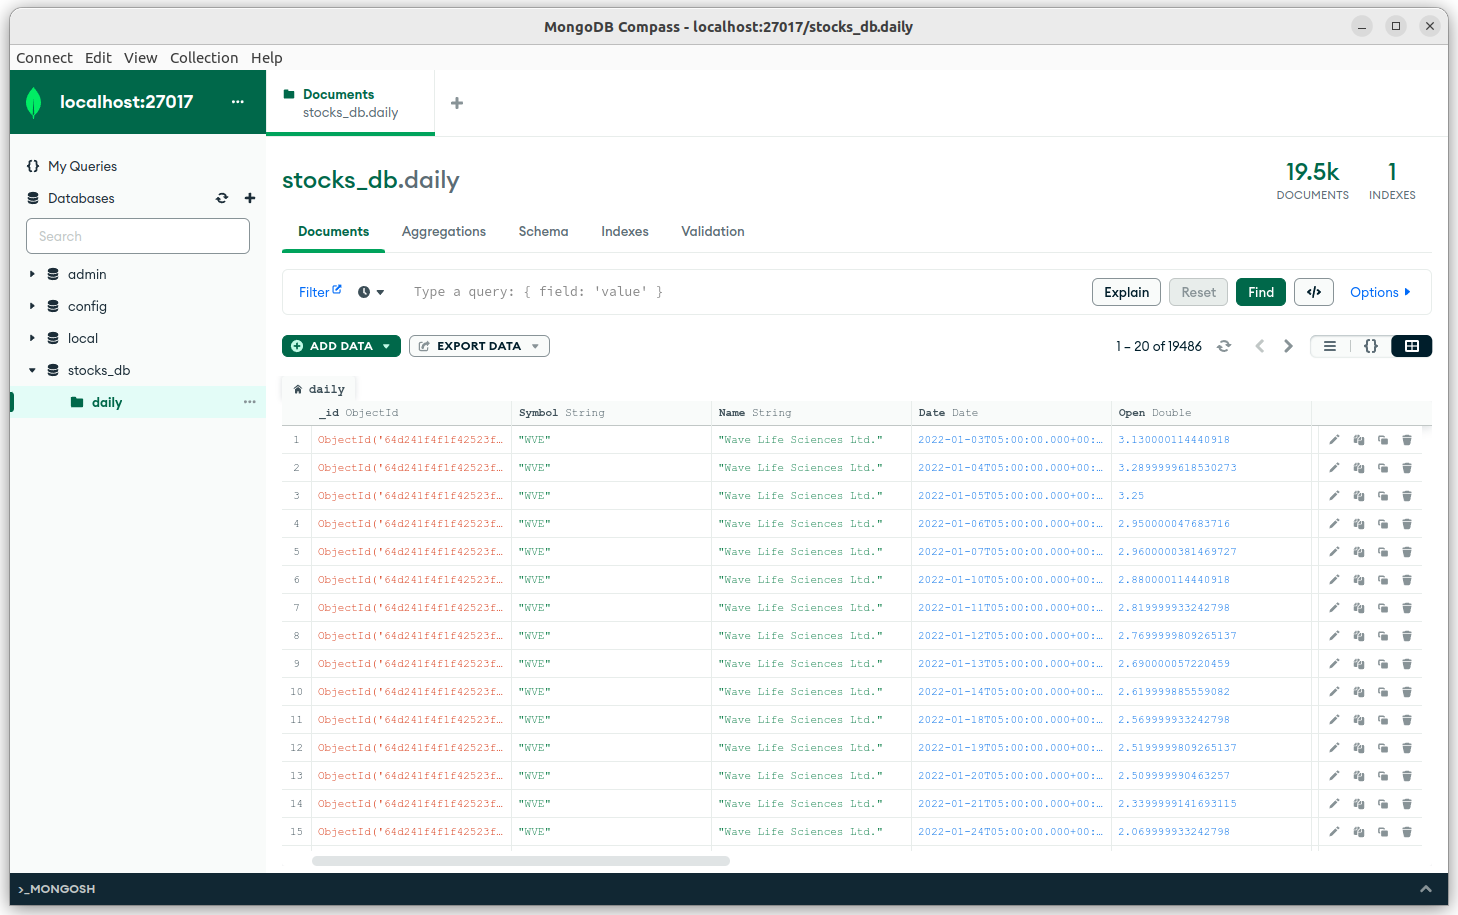
Database (MongoDB) GUI
Setup/Install
- For the 2 apps I use MongoDB and Python (with few libraries) so before being able to run the apps in a Jupyter Notebook or as Python scripts, directly from the terminal to open them in a browser, we need to install and configure both.
- The development and testing for the apps and the database backend have been done under Linux (Ubuntu 22.04.2 LTS) so this guide and steps are the ones I’ve run on such OS, but hopefully they will work on other OS with no/minor adjustments.
Install MongoDB (locally) - MongoDB Community Edition
- I assume to run MongoDB locally with the Community Edition (no cloud) and with the database backtend developed as a synchronous Python application (I use PyMongo, the official MongoDB driver for synchronous Python applications).
- In case we need to run the database backend on the cloud we could use MongoDB Atlas or other cloud services like Amazon AWS, etc.
- In case we want to develop the database as an asynchronous Python application, we could use the
motorofficial async driver for MongoDB: - The following commands and notes are for Ubuntu 22.04 and are based on:
- For other OS please check the page:
- https://www.mongodb.com/docs/manual/administration/install-community/
Steps to Install MongoDB:
sudo apt-get install gnupg curlcurl -fsSL https://pgp.mongodb.com/server-6.0.asc | sudo gpg -o /usr/share/keyrings/mongodb-server-6.0.gpg --dearmor- Create a list file for MongoDB, i.e., file on local machine where the APT package manager looks for online sources of MongoDB to download and install.
- Ubuntu 22.04 (Jammy):
echo "deb [ arch=amd64,arm64 signed-by=/usr/share/keyrings/mongodb-server-6.0.gpg ] https://repo.mongodb.org/apt/ubuntu jammy/mongodb-org/6.0 multiverse" | sudo tee /etc/apt/sources.list.d/mongodb-org-6.0.list- Install the latest stable version
- in case of problems:
sudo apt updatesudo apt-get install -y mongodb-org- Start running the MongoDB Community Edition process
- https://www.mongodb.com/docs/manual/tutorial/install-mongodb-on-ubuntu/#run-mongodb-community-edition
- check
initsystem used by OSps --no-headers -o comm 1
sudo systemctl daemon-reloadsudo systemctl start mongod- Verify that MongoDB has started successfully
sudo systemctl status mongod- type
qto exit the status log on terminal - (optional) ensure mongodb service auto-start on system reboot
- type
sudo systemctl enable mongod- (optional) stop mongodb service once the application is no longer needed
sudo systemctl stop mongod- (optional) check warnings and if default port is
27017
- (optional) check warnings and if default port is
mongosh- exit by typying
quit
- https://www.mongodb.com/docs/manual/administration/install-community/
Install MongoDB Compass (GUI for database)
This is not needed but it is useful to observe the database content from a GUI. Please check the following address on how to install the MongoDB GUI: https://www.mongodb.com/dos/compass/master/install/
Python Setup
- For Python I assume that Anaconda is already installed on the target machine, otherwise this needs to be done beforehand. Please check the following page in that regard:
- To run the apps, a new conda environment is required, and this can be built using the
environment.ymlfile provided and executing the following command from terminalconda env create --name py38_env --file environment.yml
Jupyter Notebooks, Python Scripts and Folder Structure
The following is the structure of the project folder with the required files to run the apps. In particular:
typography.cssis a css file that contains some formatting for the Dash components of the 2 apps- the folder
assetsand the filetypography.cssmust be kept in this position relative to the other files (notebooknotebook.ipynband python scriptsapp1.pyandapp2.py) - notebook
notebook.ipynbcontains the same python code that is split into the 3 python scriptsapp1.py,app2.pyanddb_run.pyso that the apps can be run either, via the Jupyter Notebook or the *.py scripts via terminal environment.ymlis the yml file required to create the conda environment- the folder
symbolscontains 4 CSV files:GSCP.csvcontains the stock symbols for the S&P 500 Stock Index and the related stocksNDX.csvcontains the stock symbols for the Nasdaq 100 Stock Index and the related stocksRUT.csvcontains the stock symbols for the Russell 2000 Stock Index and the related stocksindex_symbols_bool.csvis instead a file that is automatically created at the time of creation of the database and it stores all the stock symbols and a column for each stock index to mark the inclusion of each single stock symbol to one or more stock indices (this information is also stored in the database to avoid storing duplicate data if a stock is part of multiple indices)- regarding the stock symbols I’ve written a note at the end of this readme document to give details about how I collected the various symbols
How to Create the Database and Run the 2 Apps
Once MongoDB is installed an the conda enviroment py38_env created, we can build the database and run the applications
Database Creation
We can create the database with either, the Jupyter Notebook notebook.ipynb or the db_run.py script. It must be noted that the first time the code is run (with one of the 2 possibilities, Jupyter Notebook or Python script), the file index_symbols_bool.csv gets created in the folder /symbols as well as the database stock_db and collection daily in MongoDB, as we can see from the screenshot below. In case we need to re-run the database creation, the stocks_db database must be deleted, meanwhile the CSV file will get overwritten.
Create Database with Jupyter Notebook
- change kernel to
py38_env - to create the database we can run the code in the cell below the one with title
Create/Update Database (MongoDB)by first changing some relevant parameters (e.g., start date for the data to get from Yahoo Finance)Create Database with Python Script (from terminal)
- Another possibility is to run the script
db_run.pyfrom terminal conda activate py38_envpython db_run.py
Database Update
- To update the database with the most recent data on Yahoo Finance we can simply re-run the code
- Another possibility is to setup an automatic process to do that, as an example by using a
cron jobto run daily or even usecelery(https://github.com/celery/celery). I have skipped this step.
Running of the Apps
We can run the apps with either, the Jupyter Notebook notebook.ipynb or the app1.py/app2.py Python scripts.
Run Apps with Jupyter Notebook
- Shut down Dash server on
127.0.0.1:8050(e.g., shut down other kernels using Dash) - change kernel to
py38_env - The 2 apps are stored under the cells:
- Project-1: Equities Pairs Trading
- Project-2: Multi-Variate Index Regression
- Once the code is executed the interactive GUI (built with Dash) should appear right below the executed cell
Run Apps with Python Script (from terminal, to open the WebApp in a browser)
- Another possibility is to run the script
app1.py(andapp2.py) from terminal. - Shut down Dash server on
127.0.0.1:8050(e.g., shut down other kernels using Dash) - from terminal move in the folder containing
app1.py/app2.pypython scripts- e.g.,
cd /home/sergio/work/misc/project/code/
- e.g.,
conda activate py38_envpython app1.py(orpython app2.py)- press CTRL on keyboard and click on link shown on terminal (e.g., http://127.0.0.1:8050)
- if the browser doesn’t open automatically and goes to that page, open a new browser instance and go to address http://127.0.0.1:8050
- the Dash server should start on the default port
8050, if that port is already used by another process (e.g., Jupyter Notebook that started already the Dash Server), please close such process (e.g., shut down the kernel of the Jupyter Notebook that is running the Dash server) and try to re-run the command in terminal
- the Dash server should start on the default port
- test the WebApp by using the interactive interface
- Make sure to close the app and Dash server with CTRL+C on the terminal before running a different app (e.g., run
app2.pyafterapp1.py) - The apps should look like the following if run in the browser:
Note on the Stock Symbols
The list of stocks included in each stock index aren’t always the same but in developing the database backend and the 2 apps I assumed a fixed list. In particular for the S&P 500 and the Nasdaq 100 stock indices I used Wikipedia to get the list of stocks. For the Russell 2000 stock index instead I haven’t found a reliable source for the list of stocks so I opted to get the list of symbols by looking at the iShares Russell 2000 ETF (IWM).
Details on the 3 Stock Indices
- Nasdaq-100
- Wikipedia
- https://en.wikipedia.org/wiki/Nasdaq-100
- List of symbols taken from Wikipedia as of 17/07/2023
- GOOGL and GOOG, two different class of stocks for the same company and it counts as a single company in the index
- The Wikipedia page provides a detailed description of the changes happened to the index and given the publicity and all the references provided I consider it reliable
- I saved a snapshot with the WaybackMachine of the Internet Archive:
- Nasdaq.com website
- https://www.nasdaq.com/market-activity/quotes/nasdaq-ndx-index
- https://archive.ph/jGWsH
- Checked on 20/07/2023 and it considers only 88 rows and it misses Google/Alphabet stocks so I don't consider it as a reliable list
- Wikipedia
- S&P 500
- Wikipedia
- https://en.wikipedia.org/wiki/List_of_S%26P_500_companies
- I saved a snapshot with the WaybackMachine of the Internet Archive:
- https://web.archive.org/web/20230730114639/https://en.wikipedia.org/wiki/List_of_S&P_500_companies
- Index changes mentioned here:
- https://en.wikipedia.org/wiki/List_of_S%26P_500_companies
- Wikipedia
- Russell 2000
- iShares Russell 2000 ETF (IWM) as of 27/07/2023
- FTSERussell.com website
- With the Google search “Russell 2000 Membership List site:ftserussell.com” I haven’t found an updated list of all the stocks/symbols but only old ones
Symbols removed from CSVs
- ADRO
- Aduro Biotech (present in iShares Russell 2000 ETF; merger with Chinook Therapeutics announced on 02-Jun-2020)
- GTXI
- GTx, Inc. (present in iShares Russell 2000 ETF, Reverse Merger with Oncternal Therapeutics Completed on 10-Jun-2019)
- MSFUT
- CASH COLLATERAL MSFUT USD (fund/not stock present in iShares Russell 2000 ETF)
- P5N994
- Petrocorp Inc Escrow (stock present in iShares Russell 2000 ETF; Petrocorp Inc. changed name into Motomova Inc. in June 2023 but I haven’t been able to confirm if Motomova Inc. is still part of the Russell 2000 stock index)
- PDLI
- PDL BioPharma, Inc. (stock present in iShares Russell 2000 ETF; delisted on 31-Dec-2020)
- XTSLA
- BCF Treasury Fund (fund/not stock present in iShares Russell 2000 ETF)